
Do you remember getting excited to measure your growth, whether by a pencil mark on the door frame or during a school physical? How about all the milestones that many of us look forward to for our children – crawling, walking, riding a bike, going to school, independent living, choosing careers, and more?
You shepherd your nonprofit organization through milestones as well, and you can use the Organizational Age State of Grantseeking Report as your growth chart.
Let me preface this by saying that good things come in all sizes – I topped out at 5’2” tall, and never hit the top of a growth chart, but I like to think that I made up for it with attitude. Your organization may be right-sized and feisty with a medium budget, or you may have a vision to see it grow into a multi-million dollar mission; either way, the demographics of this report can serve as your ruler.
Let’s look at a chart that reflects organizational age by annual budget, staff size, and grantseeking activity:
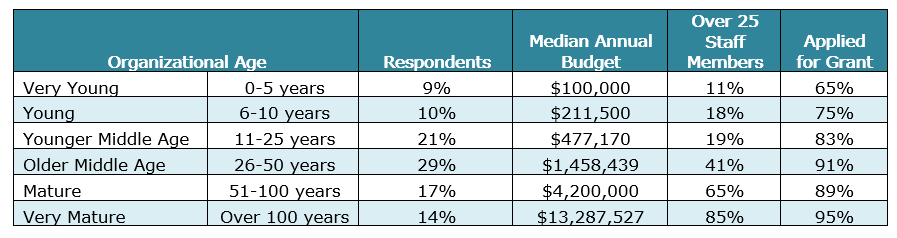
Here are some take-aways:
- Younger organizations participated in the survey at lower rates than did older organizations, in some part due to a lack of time and staff and less robust grant strategies.
- Annual budgets grow in correlation to age, which many funders feel is a definition of sustainability.
- It takes years to grow an organization to the size of 25 or more staff members; organizations do remarkable things with minimal staff.
- Larger budgets and staff = more frequent grantseeking activity.
Near the end of this report we feature a short definition of a typical organization within each age range. I think that understanding the demographic characteristics – or growth chart - for each organizational range can be very helpful as you plan your grant strategies and overall organizational strategic plans.
Here’s the synopsis for emerging, very young organizations:
- Nonprofit organizations comprised 82% of very young organizations.
- The median annual budget reported was $100,000; most very young organizations (81%) had annual budgets under $1,000,000.
- Thirty percent of very young organizations were staffed by volunteers, while 14% employed less than one full-time equivalent and 31% employed one to five people.
- Sixty-four percent of respondents from very young organizations were directly associated with their organizations at an executive level; 13% of respondents were staff-level employees.
- Grantseeking responsibilities were held by staff members (43%) and board members (24%).
- Forty-three percent were located in a mix of service area types (rural, suburban, and urban).
- The most frequent geographic service reach for very young organizations was international (16%).
- Human Services (14%), Education (12%), and Community Improvement (10%) were the most frequently reported mission focuses.
- Forty-nine percent of these organizations reported a service population of individuals/families at or below the poverty level, while poverty level was not applicable to 17% of very young organizations.
And here is the synopsis for older middle-aged, established organizations:
- Nonprofit organizations comprised 88% of older middle-aged organizations.
- The median annual budget reported was $1,458,439; more than half of older middle-aged organizations had annual budgets over $1,000,000 (59%).
- Twenty-one percent of older middle-aged organizations were staffed by one to five people, while 29% employed six to 25 people, and 41% employed 26 or more people.
- Fifty-one percent of respondents from older middle-aged organizations were directly associated with their organizations at an executive level; 37% of respondents were staff-level employees.
- Staff members (83%) held grantseeking responsibilities.
- Forty-five percent were located in a mix of service area types (rural, suburban, and urban).
- The most frequent geographic service reach for older middle-aged organizations was multi-county (30%) or one county (15%).
- Human Services (27%), Art, Culture, and Humanities (13%), and Education (12%) were the most frequently reported mission focuses.
- Fifty percent of these organizations reported a service population of individuals/families at or below the poverty level, while poverty level was not applicable to 11% of older middle-aged organizations.
What a difference those 20 years make! Median annual budget grew from $100,000 to $1,458,439 and staff sizes changed from 30% of organizations comprised fully of volunteers to 41% of organizations employing 26 or more people.
Some of this growth is fueled by grantmaker interest in organizational age as an indicator of sustainability, and some is fueled by the greater scope of services often offered by older (larger) organizations.
This chart shows the frequency of funding by grantmaker type for each age range, with the median award size by grantmaker noted.
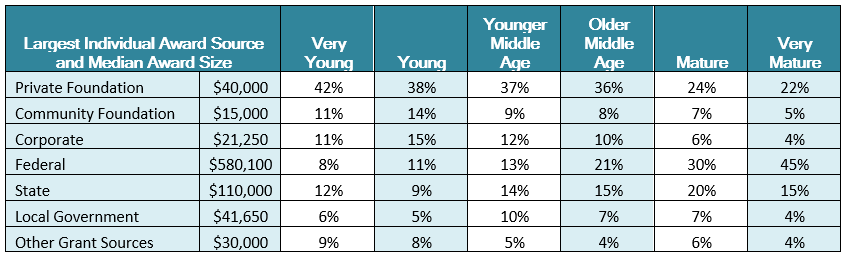
As you can see, organizations 50 years of age and older report the large Federal awards more frequently, which continues to fuel and sustain their growth. On the other hand, private foundations are supporting new initiatives from very young organizations; there are funds available for all ages.
I hope that your organization achieves the growth that you desire for it – whether it is perfect just as it is, or has a growth spurt ahead of it.
- Download the Organizational Age State of Grantseeking Report.
- Re-visit your 2018 grants plan and build some objectives based on the report findings.
- Think about where your time is best spent for the most frequent success rate!