The 2023
State of Grantseeking
Report

Introduction
The 2023 State of Grantseeking™ Report is based on the 21st informal survey of organizations conducted by GrantStation to help illustrate the current state of grantseeking in the U.S. and Canada. The primary objectives of this report are to shed light on the current trends in grantseeking and generate benchmarks by which grantseekers can measure their success in the field.
Measuring your organization's internal and external grantseeking experiences against other like organizations and their accomplishments will help you build a stronger, more resilient grantseeking program. By comparing your own organization's performance to the data we've collected, you will be able to generate a realistic grantseeking plan for 2023 and into 2024.
I would like to thank our lead survey and report underwriters: Foundant Technologies and the Grant Professionals Association. Additionally, a large thank you to ARNOVA (Association for Research on Nonprofit Organizations and Voluntary Action), CampaignCounsel.org, and TechSoup, who all served as survey and report underwriters. I also want to extend my appreciation to the many organizations that were advocates for the survey.
And of course, I must thank the 2,463 respondents who made this report possible. This is a lengthy and intensive survey that requires true commitment from the respondents, but which ultimately benefits the entire third sector. I hope that the information and benchmarks provided will assist each of you in your good work.
Finally, I would like to thank my GrantStation team—especially Ellen Mower, Juliet Vile, and Diana Holder—who dedicate hundreds of hours to this survey each year.

Cynthia M. Adams
Founder, GrantStation
Our Lead Underwriters
We extend our appreciation to the lead underwriters for their invaluable support.

Our Underwriters
We extend our appreciation to these underwriters for their invaluable support.

Our Advocates
We extend our appreciation to the following organizations and businesses for their generous support in promoting the survey.


Executive Summary
The 2023 State of Grantseeking™ Report reflects the experiences of agile organizations and funders, and skillful organizational leadership.
Grant funding is available for those organizations that engage in active grantseeking. Ninety-one percent of our respondents submitted at least one grant application in 2022, and of those, 88% received at least one grant award.
Submitting a higher number of applications increased the likelihood of winning awards. Among organizations that submitted just one grant application, 64% won an award. However, at least one award was received by 90% of respondents who submitted three to five grant applications, and 98% of those who submitted six to ten applications. So, one way to increase the chance of winning grant awards is to submit at least three applications.
Private foundations continue to be a funding source for most respondents; 78% received awards from this source. Private foundations were most frequently reported as the largest source of total funding (30%) and the source of the largest award (30%). Although government awards are still “big money,” private foundations are more frequent funders.
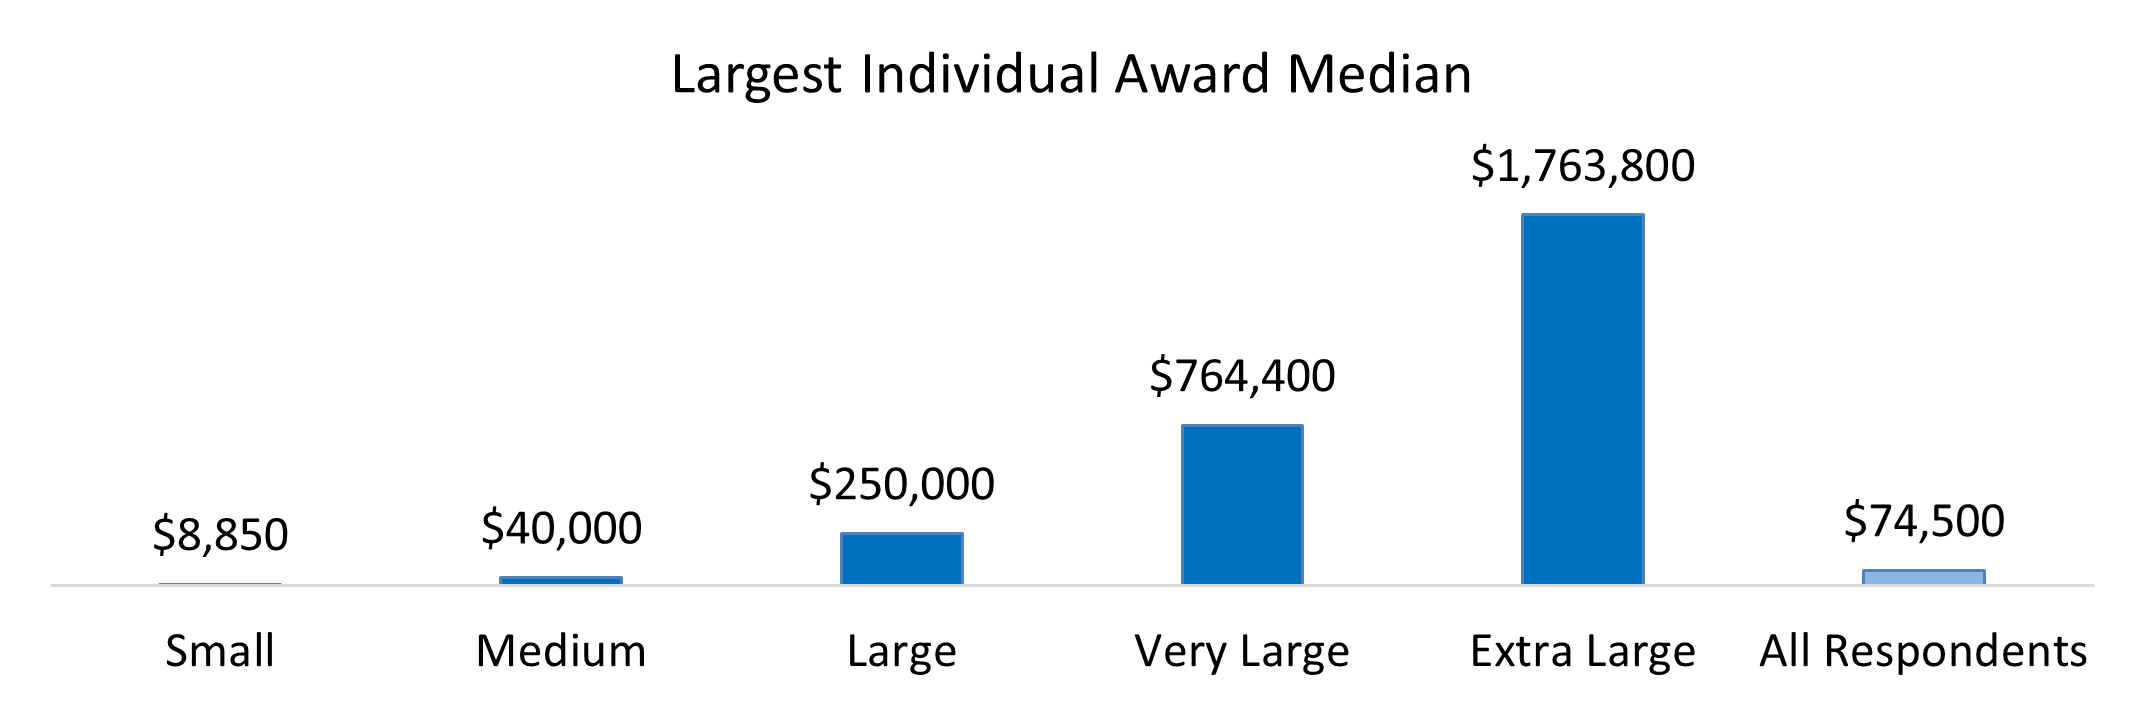
The median largest individual award for all respondents was $74,500. This figure varied by grantmaker type, organizational annual budget, and mission focus. For example, the median largest individual award received from community foundations was $20,000, compared to $423,435 from the Federal government. Within budget ranges, the median largest individual award received by small organizations (budgets under $100,000) was $8,850, while extra-large organizations (budgets over $25 million) reported a median largest award of over $1.7 million.
Even an organization’s mission focus has an impact on award size. Organizations with an Animal Related mission reported a median largest award of $25,000, while the median largest award was $225,000 for Housing and Shelter organizations and $1.5 million for Educational Institutions.
The opportunity cost—the in-depth knowledge, staff, and time required in the grant process—should be weighed against the size of an award and the likelihood of winning that award. The grant process takes an investment of days, and in many cases weeks, to complete an application.
Respondent data continues to suggest that successful grantseeking is made more difficult by organizational staff and time limitations (24%), increased funder practices and requirements (15%), difficulty in finding grant opportunities that matched with specific missions, locations, or programs (14%), competition for finite monies (9%), and building funder relationships (8%). These struggles relate to the most frequently reported techniques for lowering or maintaining indirect/administrative costs, which included reductions in the number of staff (37%).
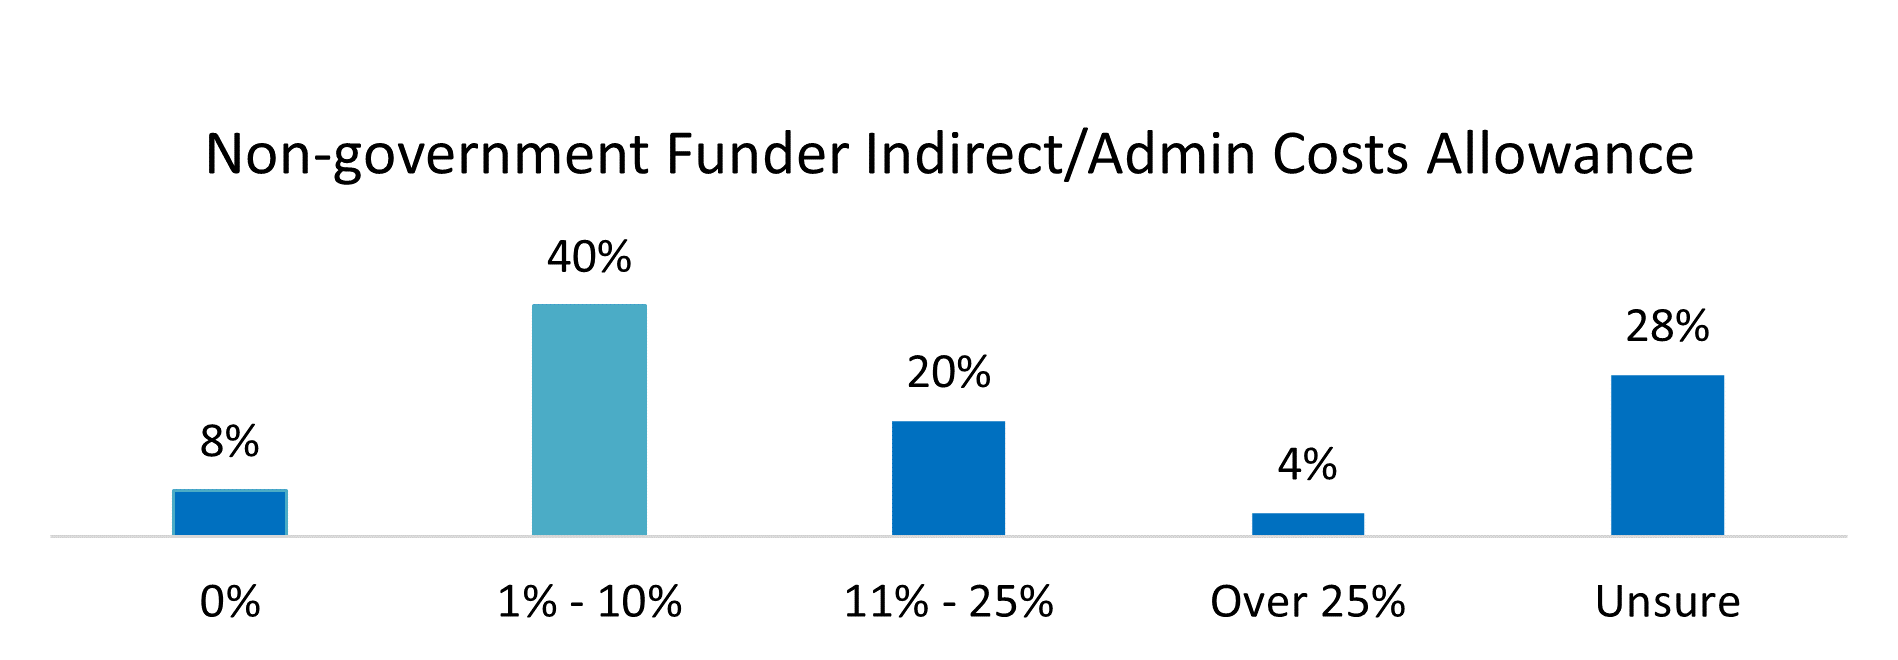
While it was reported that non-government funders will generally assist with indirect/administrative costs, they limit the amount that they are willing to cover. Only 8% of respondents reported that non-government funders would not cover any level of indirect/administrative costs. However, 40% of respondents reported an allowance of 10% or less for these costs and 28% were unsure of cost coverage.
We at GrantStation hope The 2023 State of Grantseeking™ Report helps to alleviate some of the frustration among nonprofit organizations as they engage in grantseeking activities. Overall, this report speaks to the importance of targeting the right grantmakers. How can this report help your organization find the funding it needs?
First, compare your organization’s grantseeking to this report, and note the benchmarks for funder type and award size for your organization’s annual budget and mission. Are there areas where your organization excels, or where it could stand to improve? Next, using the results of this survey as one of your guides, set realistic expectations for both the projected contribution of grant awards to your total budget, and the time and staff required to engage in grantseeking.
You may wish to use our free Benchmarker tool, which enables you to get personalized information and reports from the results of The State of Grantseeking™ Survey.
Because these reports are meant to serve you and to help you determine where you need to focus your energy, you may consider setting aside time in your next board of directors meeting to discuss this report and how the information can be used to help you build a successful and resilient grantseeking strategy.
Finally, consider investing in tools to help organizational growth, such as Membership in GrantStation. At GrantStation, we help you to keep your organization financially healthy through assistance in developing a strong grantseeking strategy. Member Benefits provide the tools for you to find new grant sources, build a strong grantseeking program, and write winning grant proposals.
Ellen C. Mowrer
Ellen C. Mowrer
Chief Executive Officer, GrantStation
Key Findings
Grantseeking Activity
- Ninety percent of respondents applied for grant funding in 2022.
- Among the organizations with active grantseekers, 74% reported that one to two people were directly involved with the grant process.
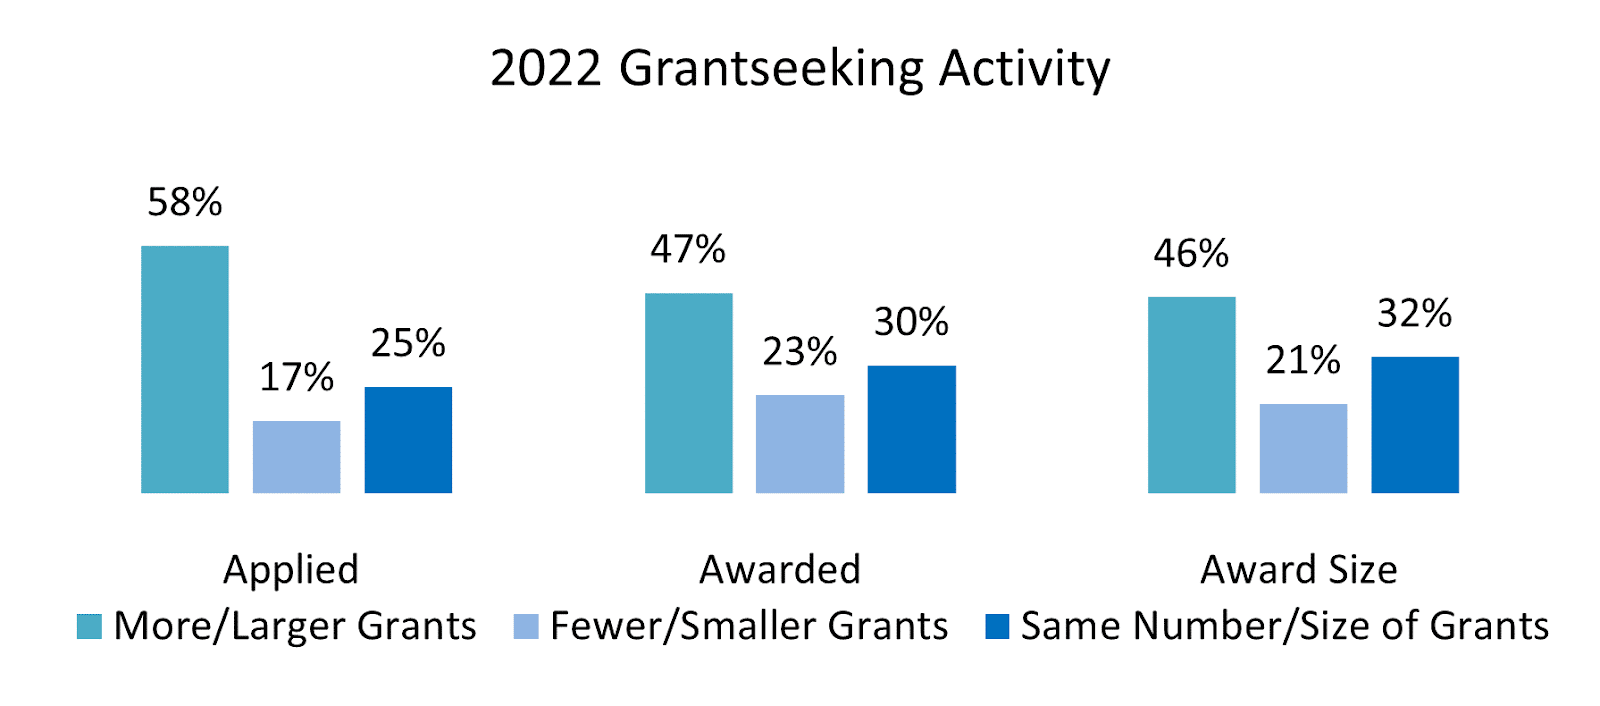
- Compared to the same period in the prior year, 58% of respondents applied for more grants and 47% were awarded more grants. In addition, 46% reported the receipt of larger awards.
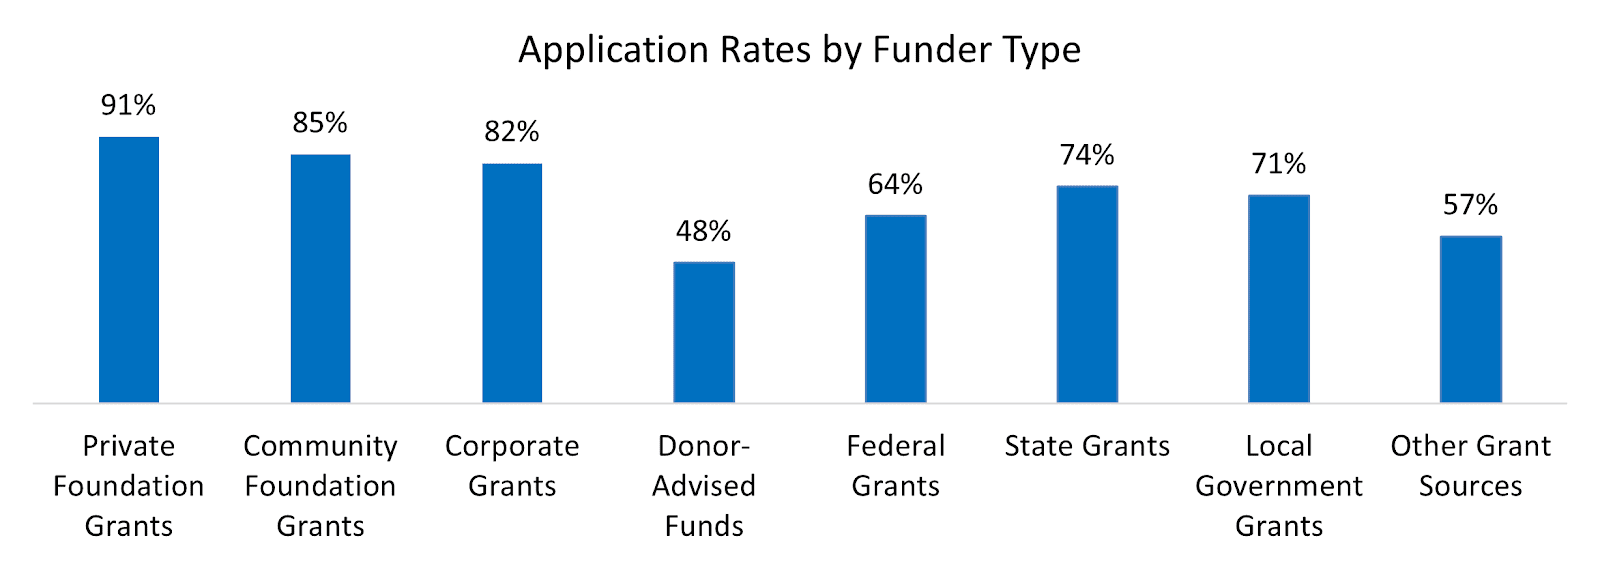
- Application rates varied by funder type; 91% of respondents applied for private foundation funding in 2022 while 64% applied for Federal funding.
- Applying for at least three grant awards increased the frequency of winning an award. Thirty-six percent of organizations that submitted one application won no awards. However, the percentage of organizations that won at least one award was high among organizations that submitted three to five applications (90%), six to ten applications (98%), or eleven or more applications (99-100%).
Awards
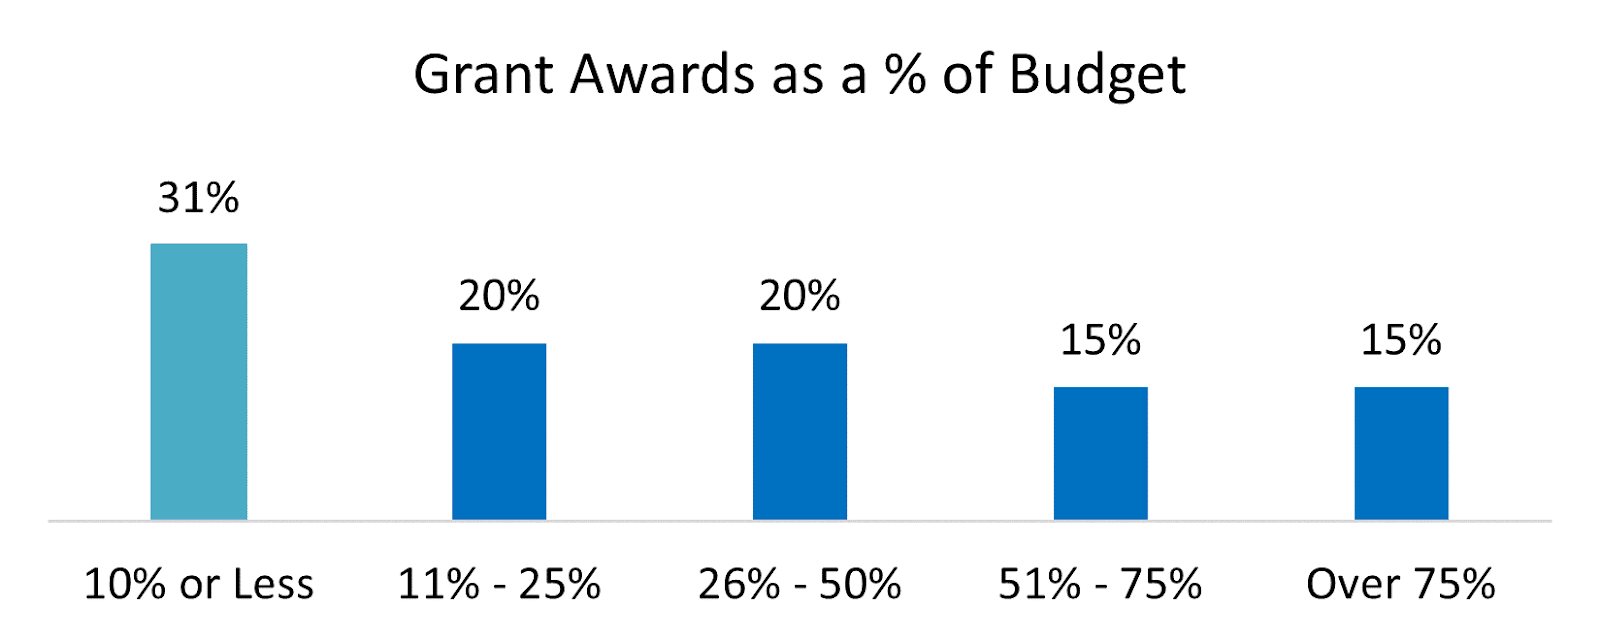
- Fifty-one percent of respondents reported grant funding as comprising 25% or less of their annual budget.
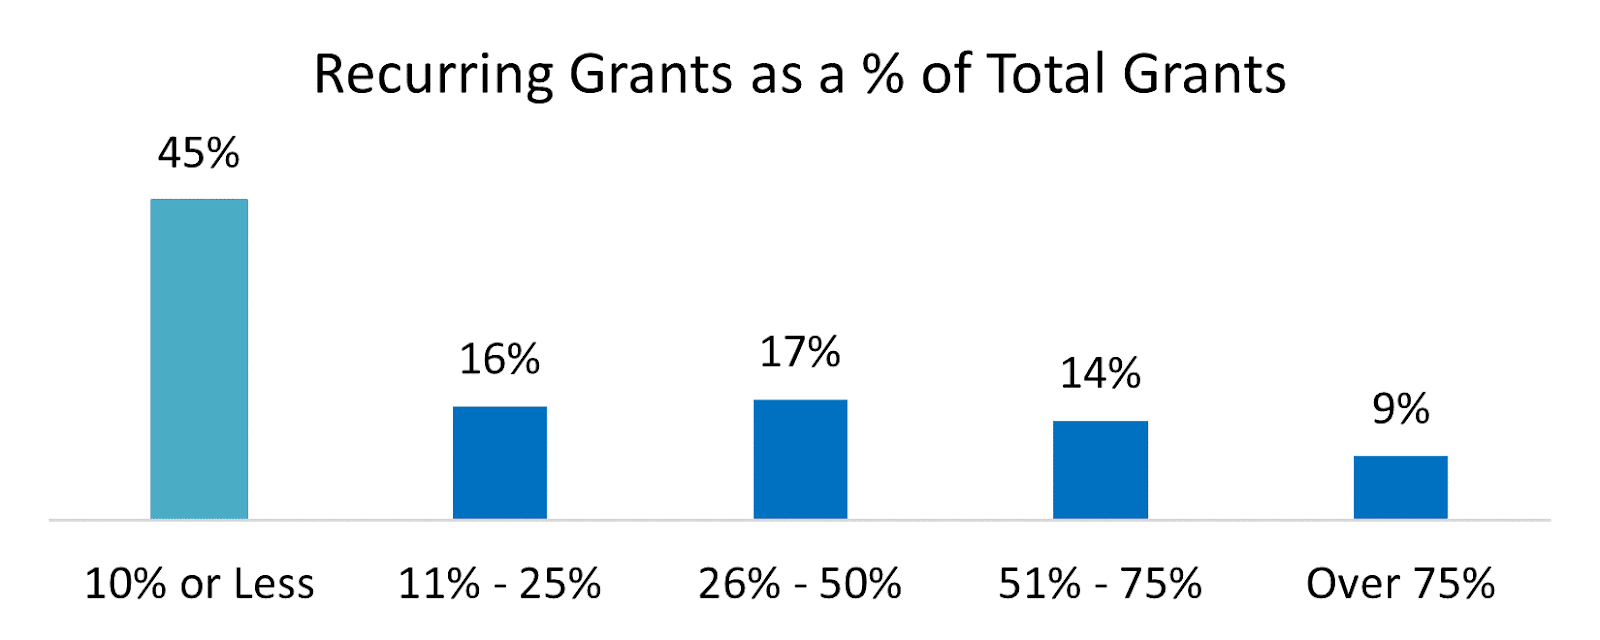
- Recurring grants were 10% or less of total grants for 45% of respondents, and 11% to 50% of total grants for 33% of respondents.
- The median total grant funding was $150,000; the median largest individual award was $74,500.
- The median largest award from non-government funders (an aggregate of private foundations, community foundations, corporate grantmakers, donor-advised funds, and “other” funding sources) was $40,000.
- The median largest award from government funders (an aggregate of local, state, and Federal government) was $218,000.
- The most frequently reported type of support for the largest award was project or program support (37%); general support was the largest award type for 23% of respondents.
Federal government awards
- Of all respondents to The 2023 State of Grantseeking™ Survey, 40% stated that their organizations receive Federal funding on a regular basis and 36% stated that they received Federal funding in 2022.
- The largest award median for the Federal government was $423,435.
- Most organizations that received Federal funding in 2022 reported that their largest Federal award came in the form of grants (66%) or contracts (10%).
- Forty-four percent of the funds for the largest Federal award originated directly from the Federal government; 25% originated as pass-through Federal funding via a state government.
- Twenty-five percent of respondents reported that matching funds were required in their largest Federal award. Of those, 33% reported a match of 25% or less.
- Fifty percent of respondents reported that their largest Federal award included indirect or administrative cost funding.
Donor-Advised Fund Awards
- Among our respondents, 33% reported donor-advised funds as a source of funding.
- Donor-advised funds were the largest source of total funding for 2% of respondents.
Largest Award Logistics
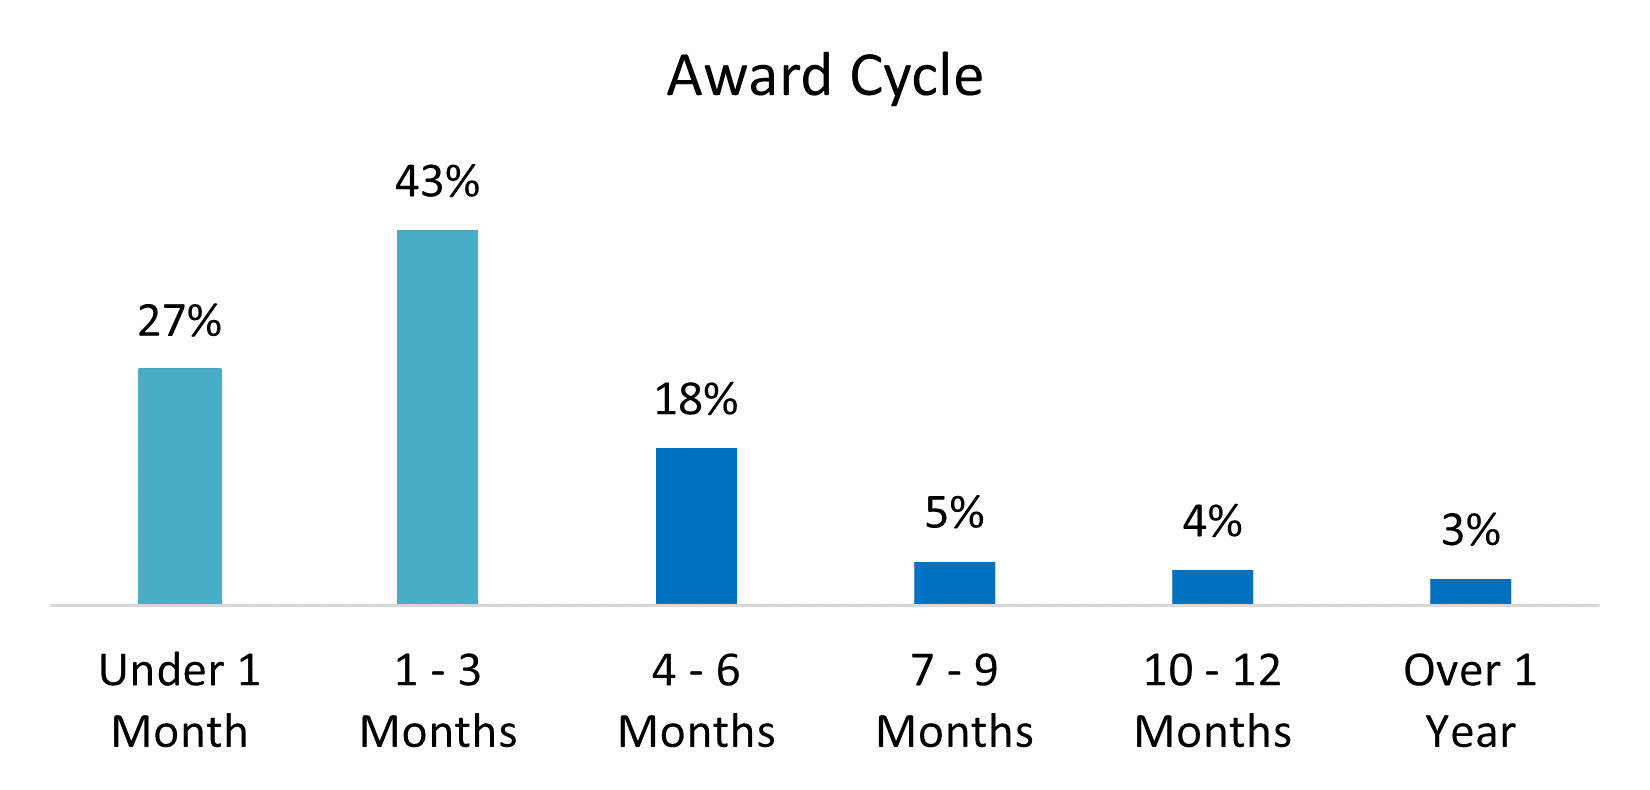
- The grant cycle length—from proposal submission to award decision—for the largest grant award was between one and six months for 60% of respondents.
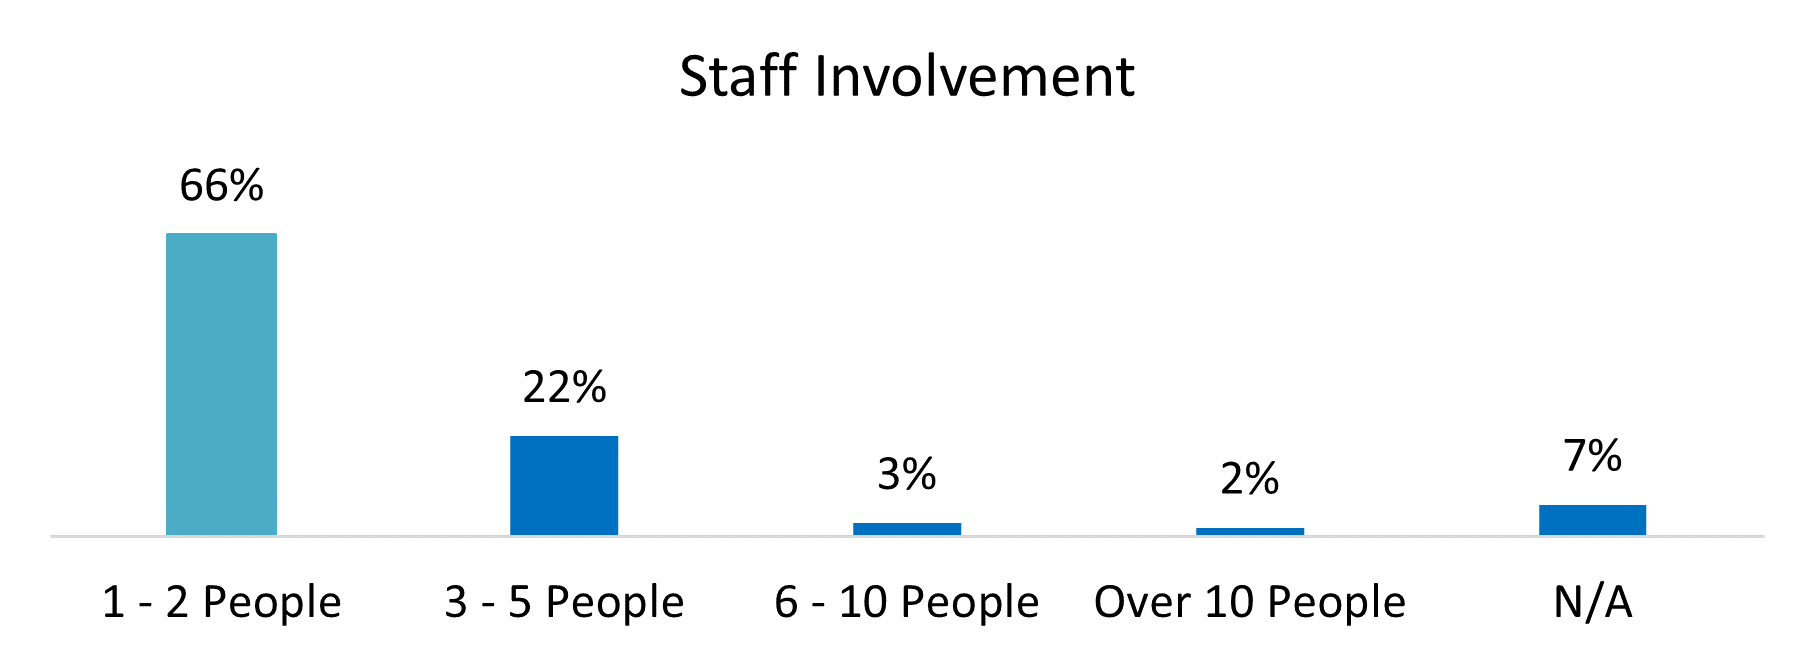
- The grant process takes staff. For 66% of respondents, one to two people were directly involved in the grantseeking process for the largest individual award, while for 22% of respondents, three to five people were directly involved.
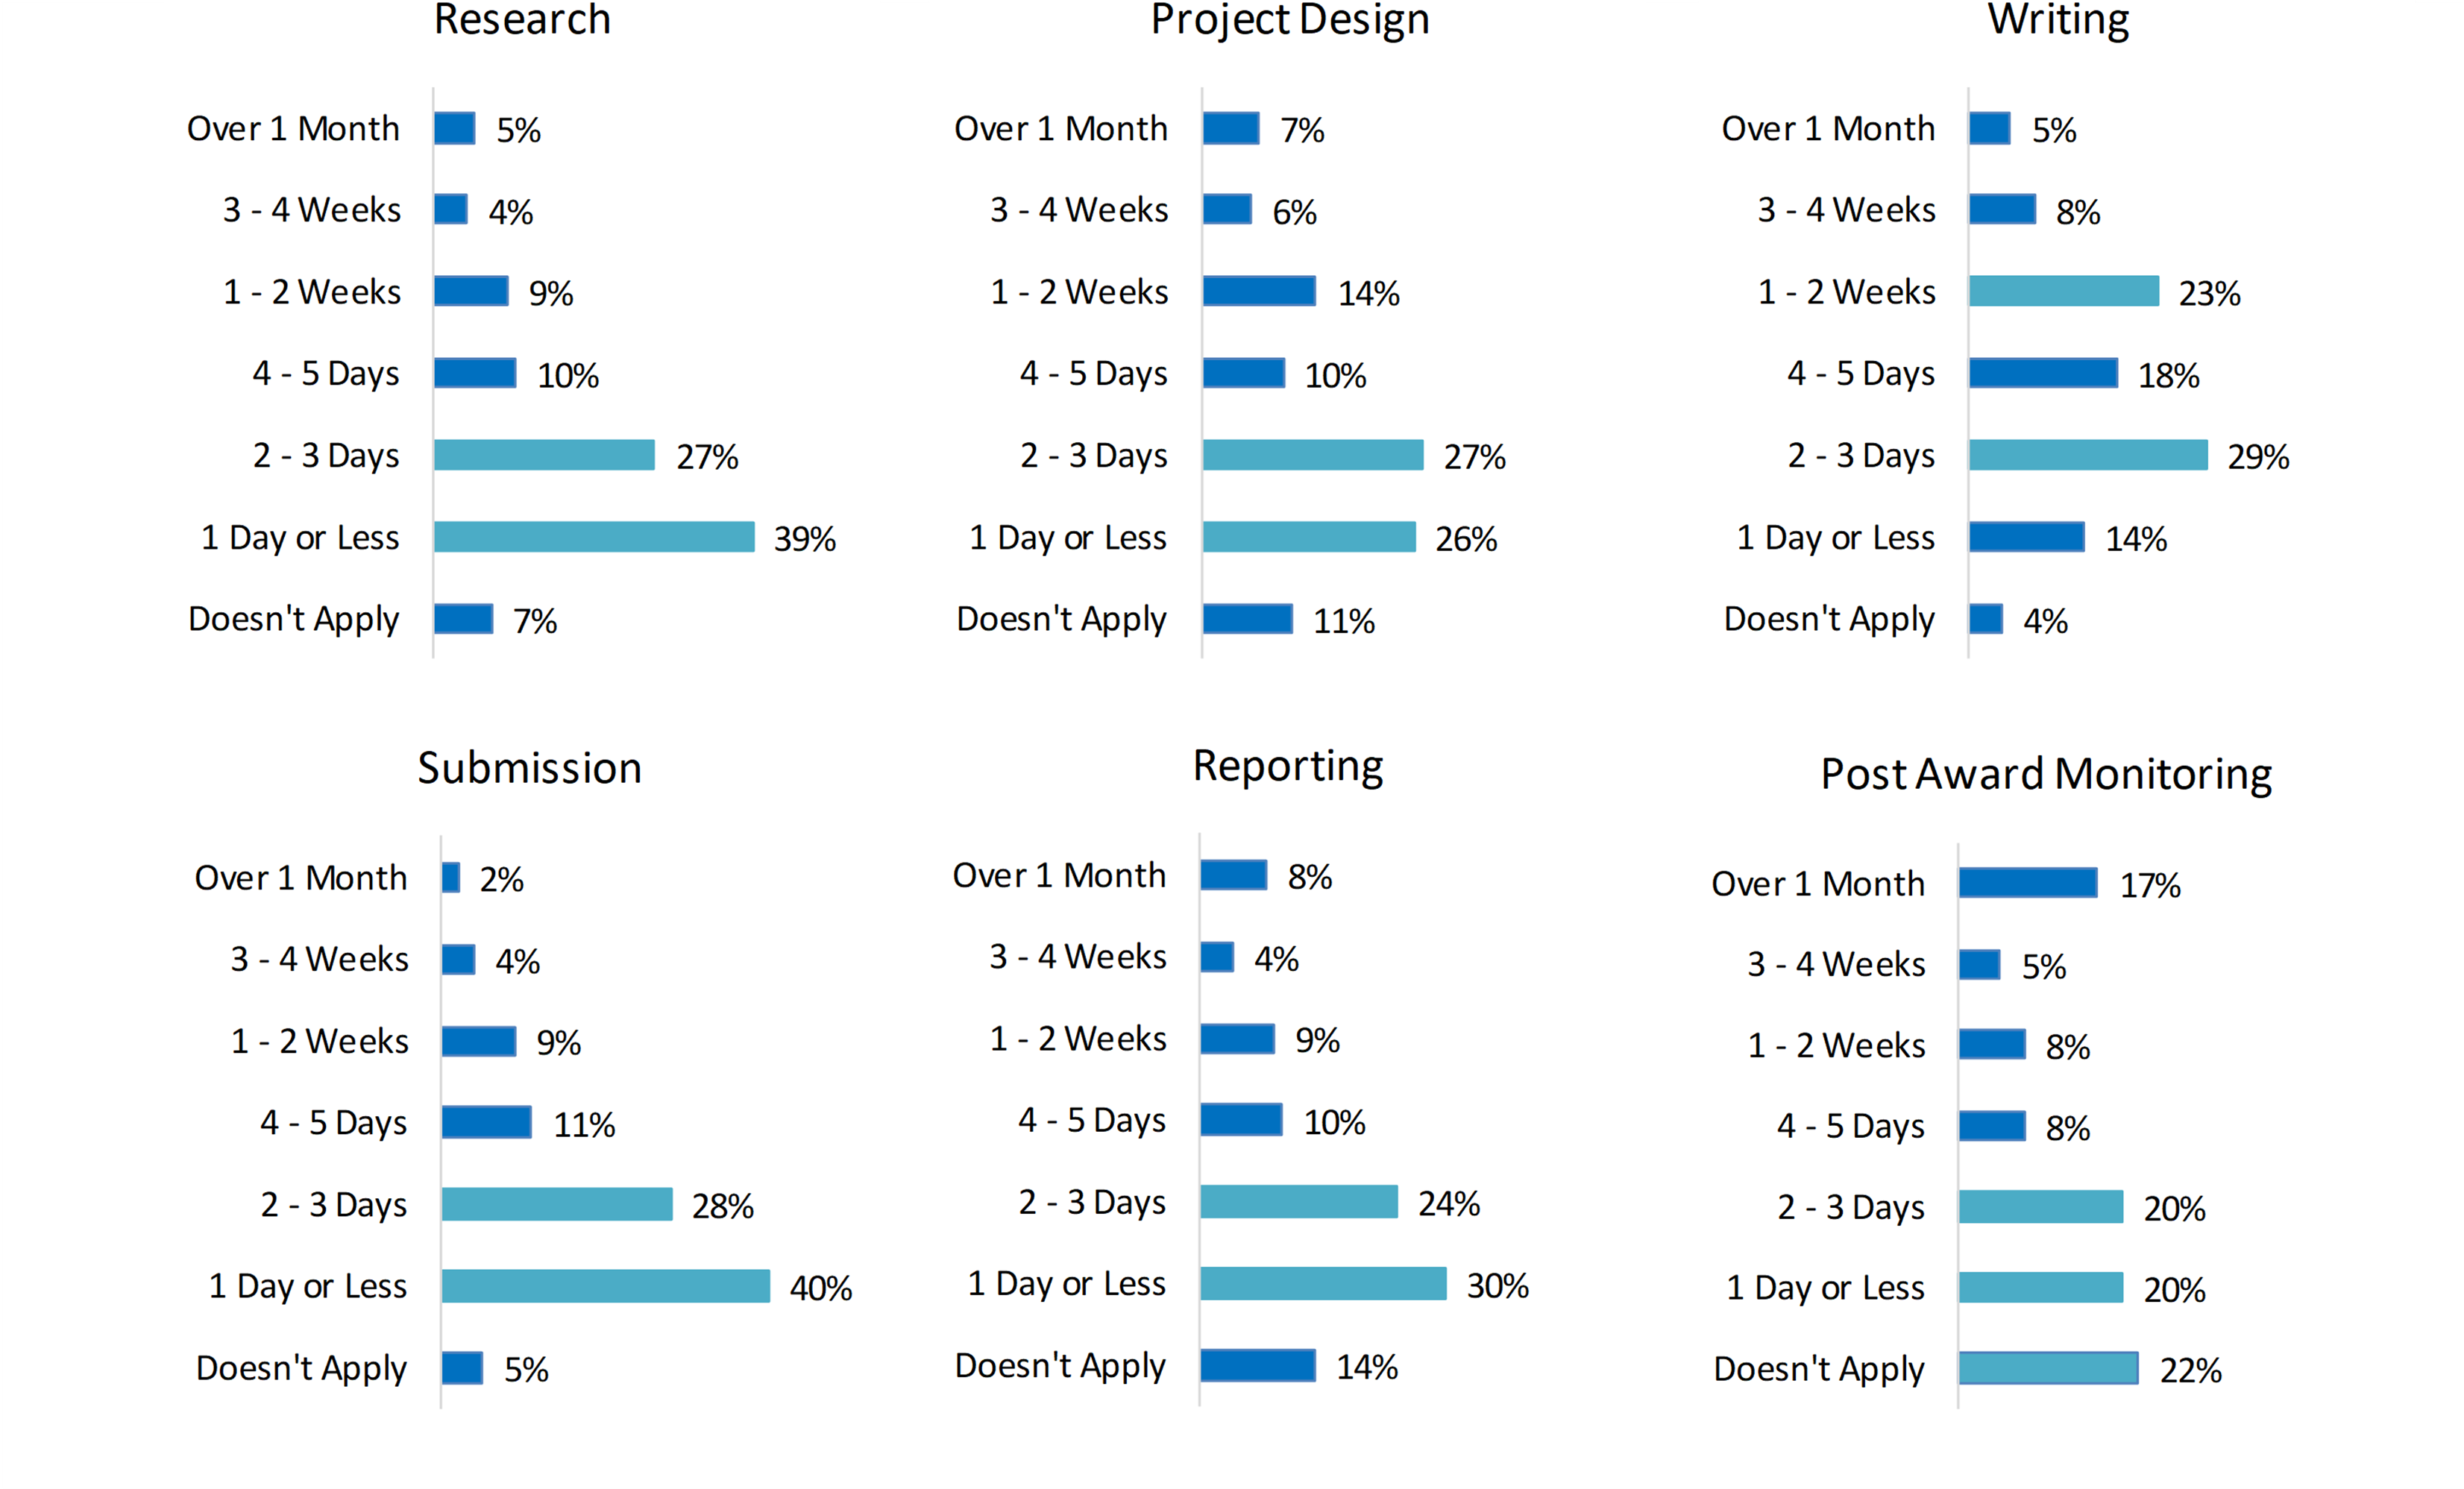
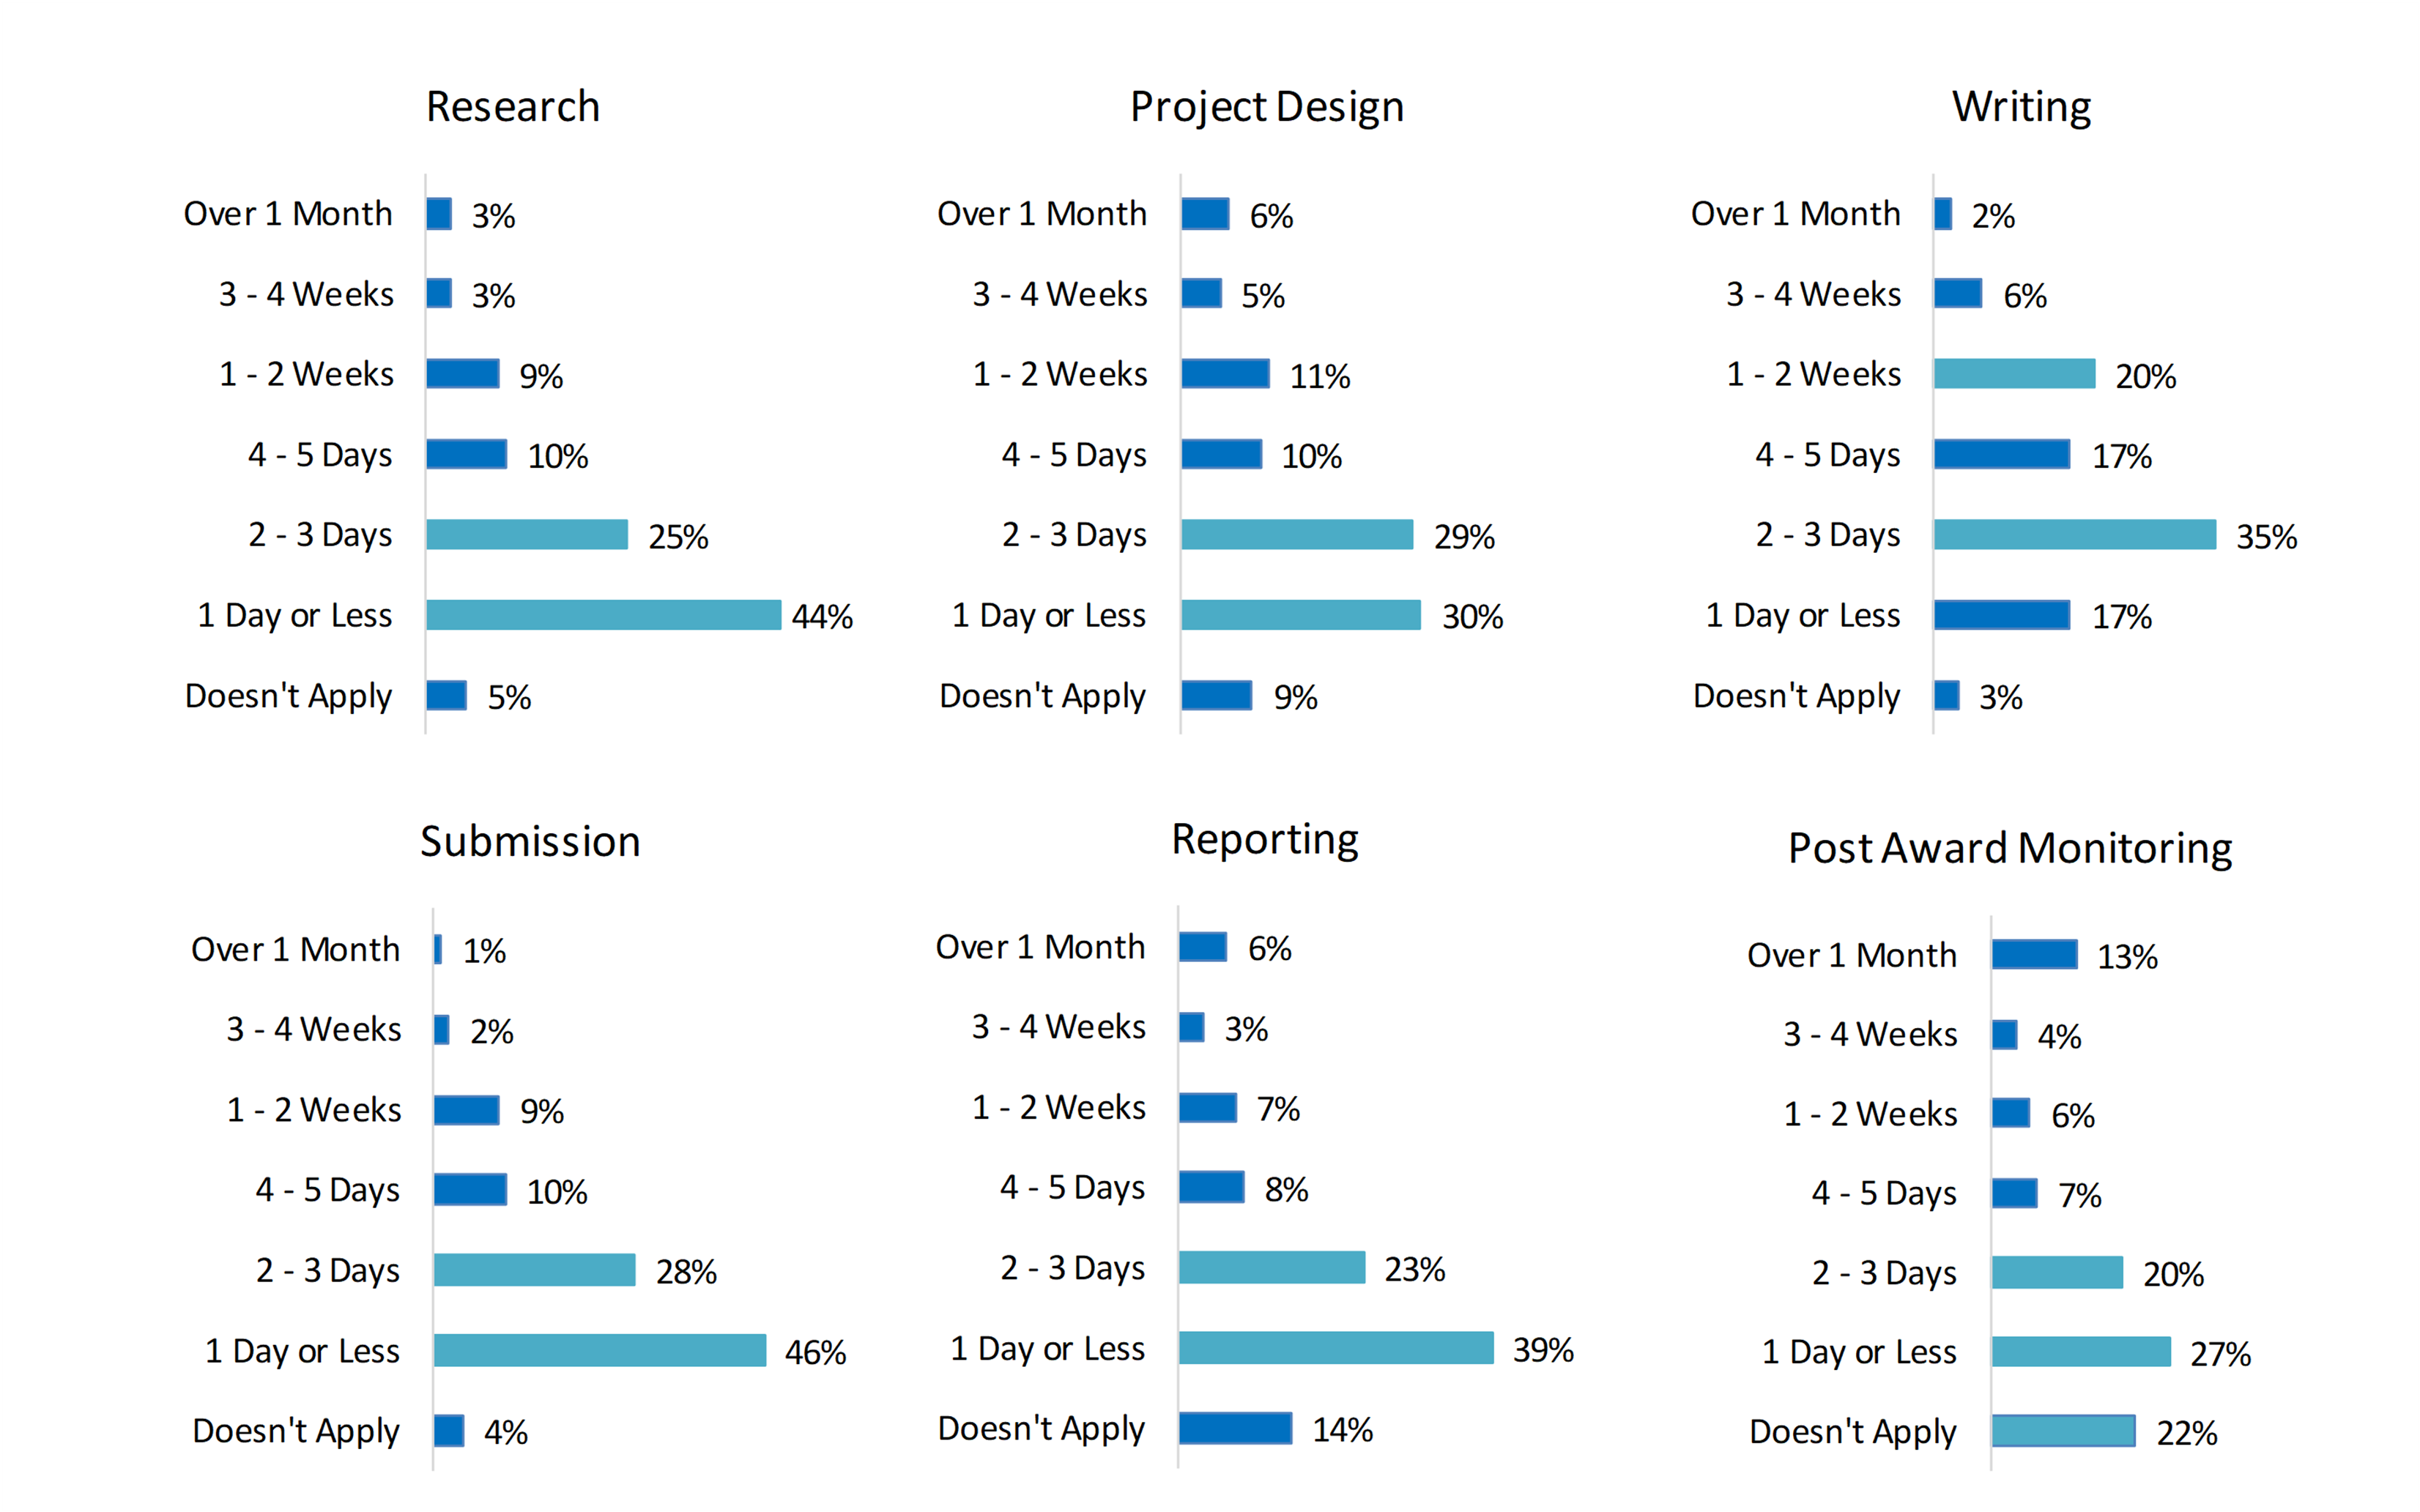
- The grant process takes time. Grant research took three days or fewer for 66% of respondents. Project design and planning took three days or fewer for 53% of respondents, while writing the grant application took between two days and two weeks for 70% of respondents. Application submission took three days or fewer for 68% of respondents and reporting requirements took three days or fewer for 54% of respondents. Post-award monitoring took three days or fewer for 40% of respondents, whereas it wasn’t applicable for 22% of respondents.
- Once an award decision had been determined, funders released the award monies quickly; 70% of respondents reported receiving the award within three months of notification.
Indirect/Administrative Costs
- Compared to indirect/administrative costs for the prior year, 42% of respondents reported that these costs had remained the same, while 50% reported that these costs had increased. Indirect/administrative costs decreased for 8% of respondents.
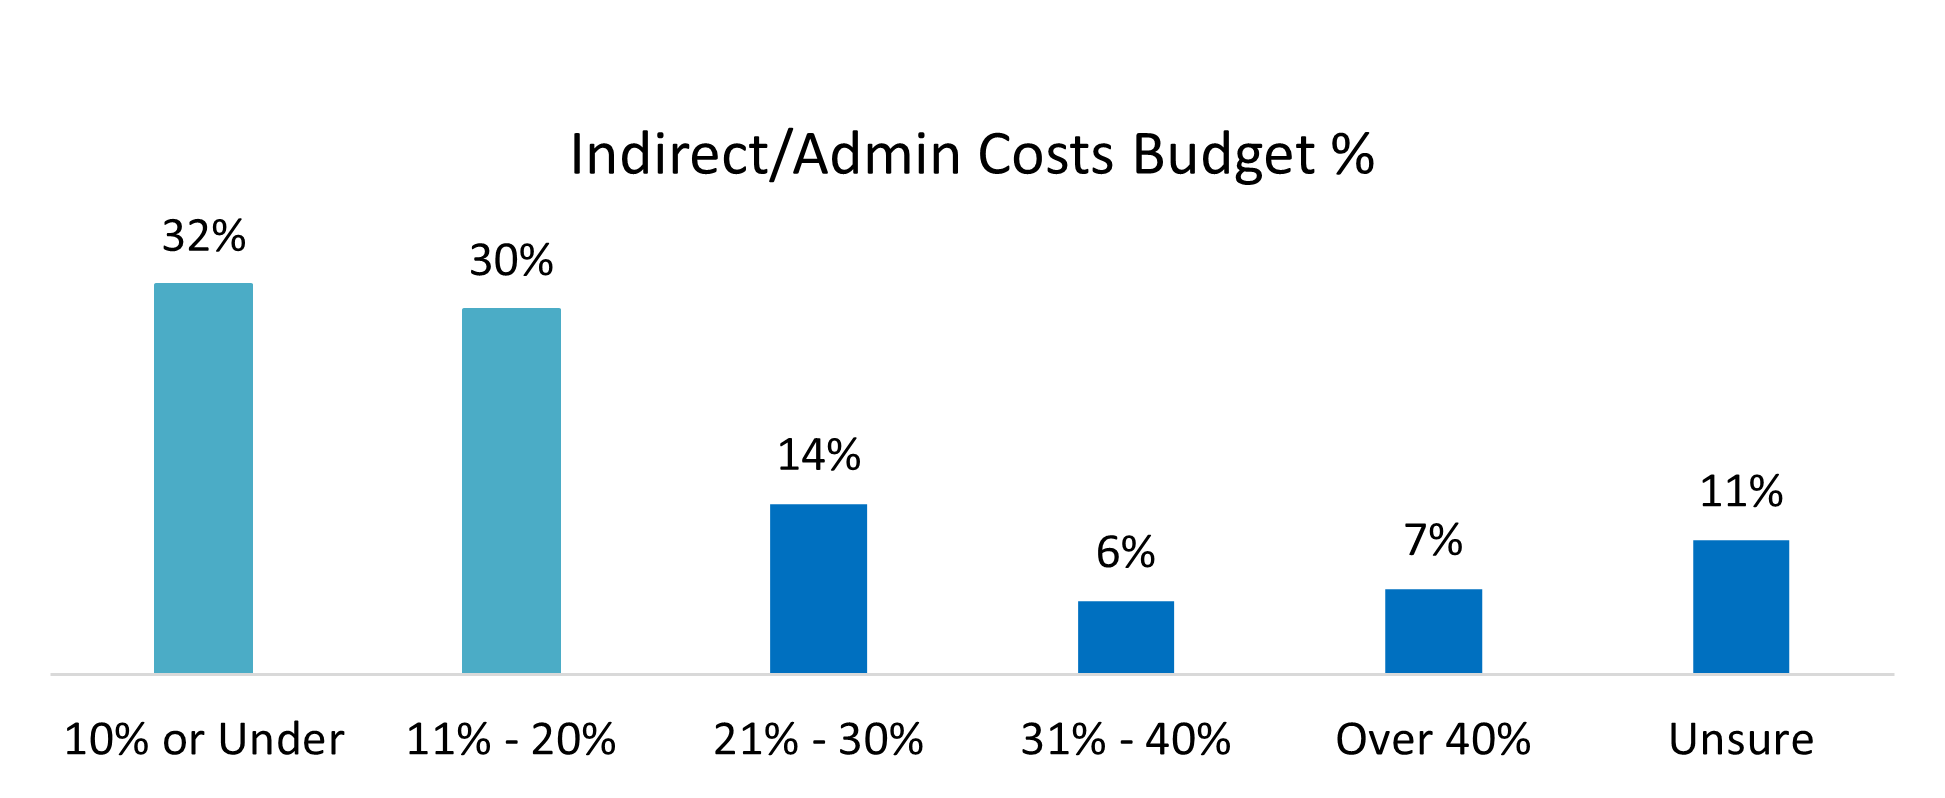
- Respondents kept their costs low; 62% reported indirect/administrative costs as 20% or less of their total budgets.
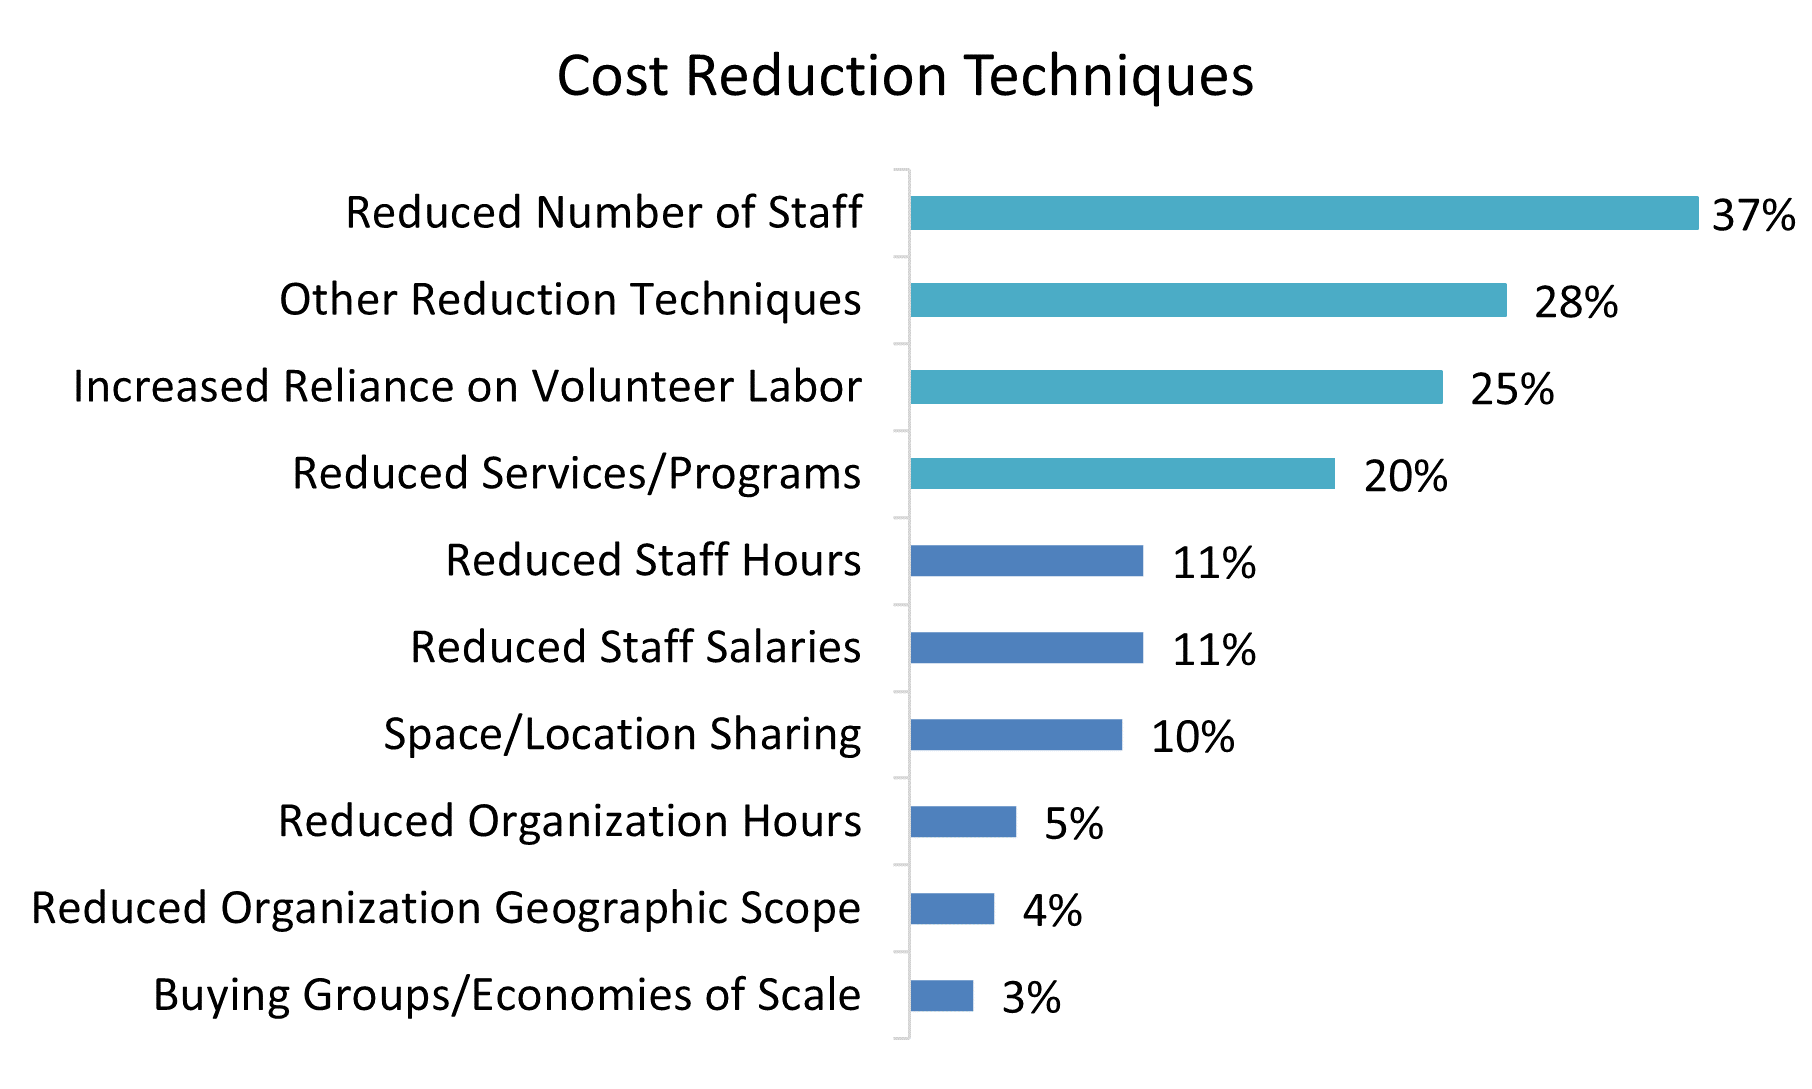
- The most frequently reported indirect/administrative cost control techniques involved reductions in the number of staff (37%), reliance on volunteer labor (25%), and “other” reduction techniques (28%) including cost savings through hiring freezes, virtual work, and non-replacement of technology.
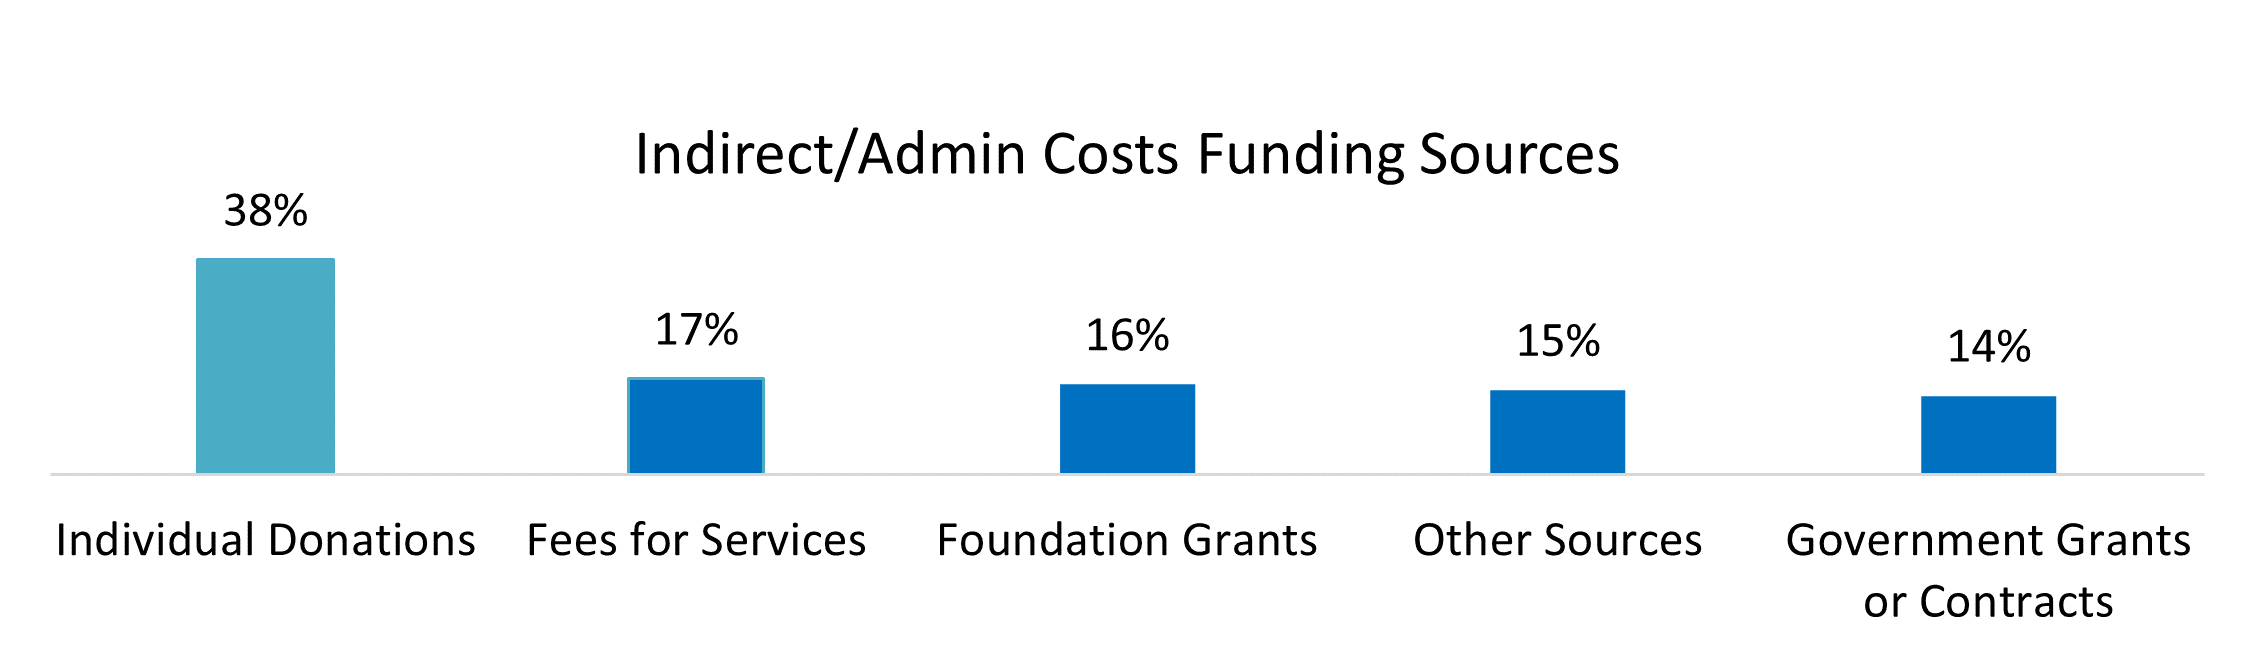
- Individual donations (38%) were the most frequent source of indirect/administrative funding.
- Only 8% of respondents reported that non-government funders would not cover any level of indirect/administrative costs. However, 40% of respondents reported an allowance of 10% or less for these costs and 28% were unsure of cost coverage.
Collaboration
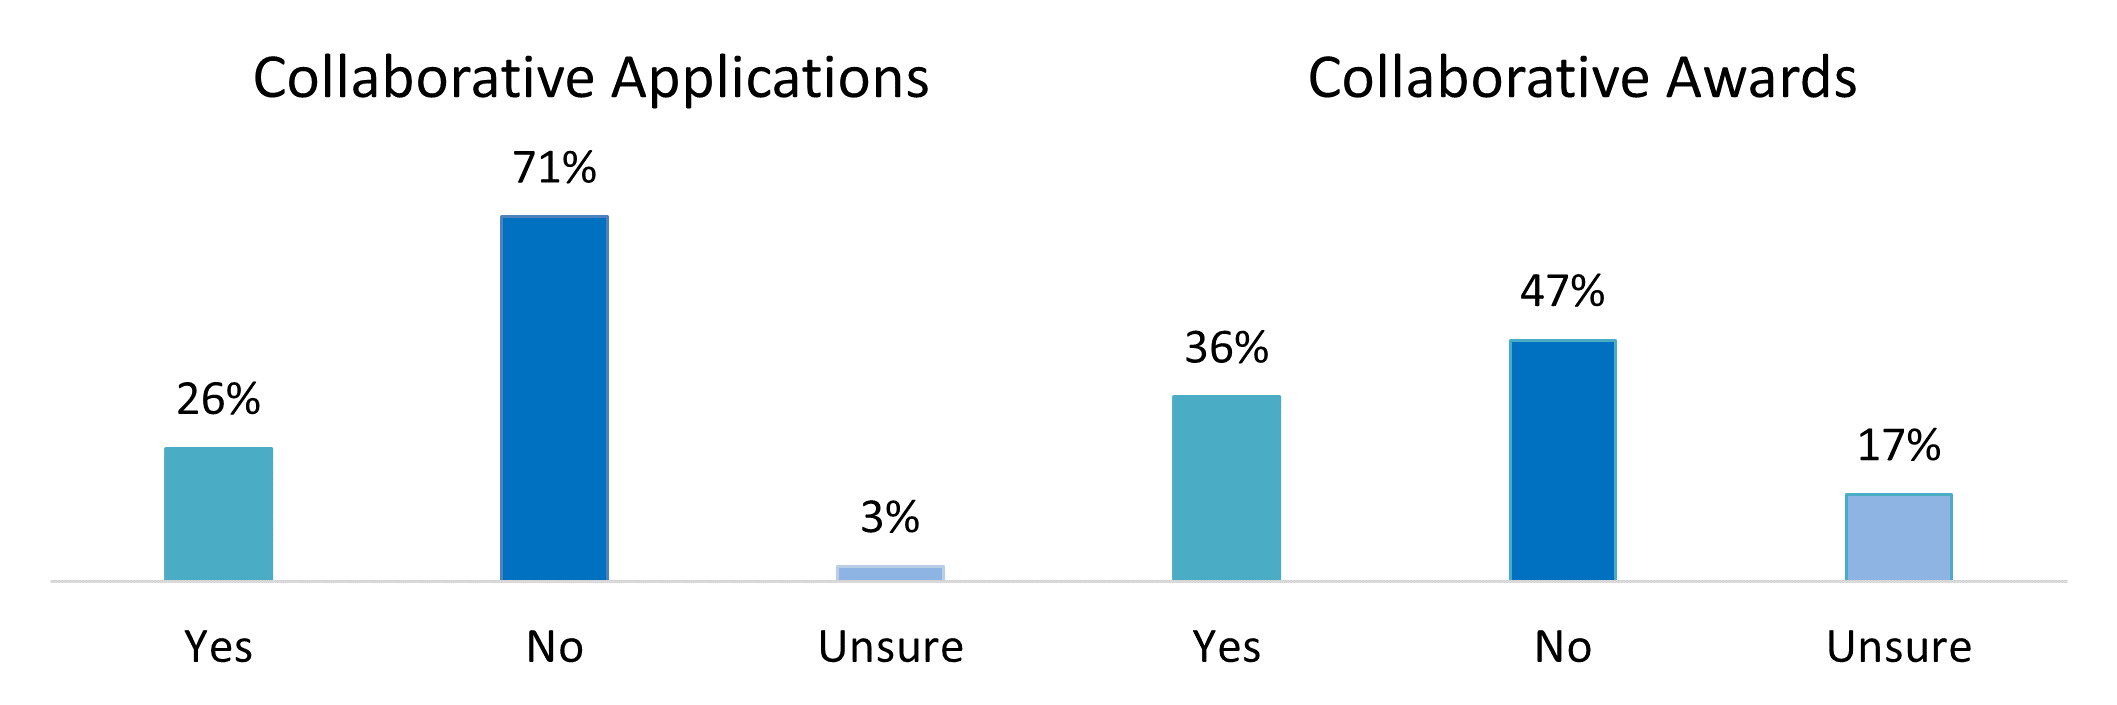
- Most respondents (71%) did not participate in collaborative grantseeking in 2022.
- Thirty-six percent of those respondents that did submit a collaborative grant application reported winning an award.
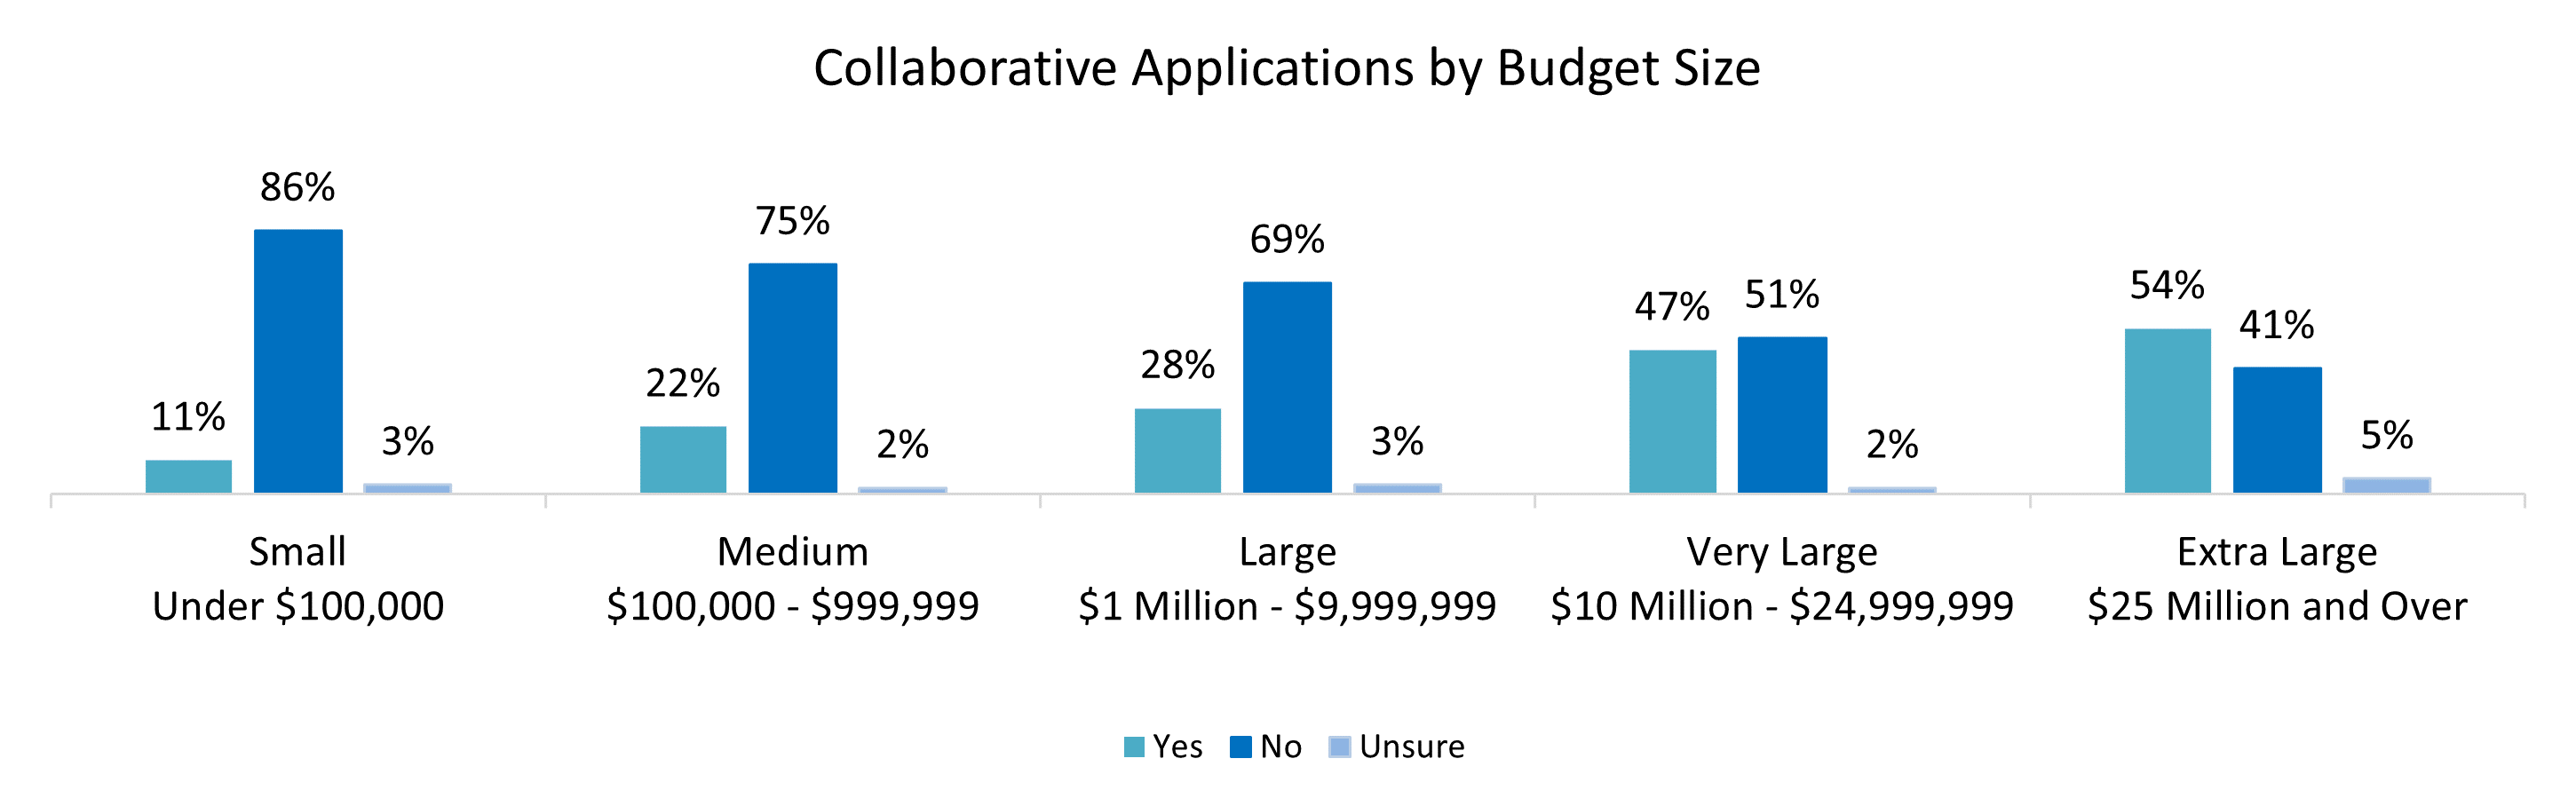
- Increases in annual budget size, with the implied increases in staff and infrastructure, influenced collaborative activities. Fifty-four percent of organizations with budgets of $25,000,000 or more participated in collaborative grantseeking in 2022, whereas 11% of organizations with budgets under $100,000 engaged in collaborative grantseeking during this period.
Challenges to Grantseeking
- Lack of time and/or staff (24%) continued to be the greatest challenge to grantseeking among respondents.
- Increased funder requirements (15%), difficulty in finding grant opportunities that matched with specific missions, locations, or programs (14%), competition for finite monies (9%), and building funder relationships (8%) were also frequently cited as the greatest challenge to successful grantseeking.
Organization Annual Budget
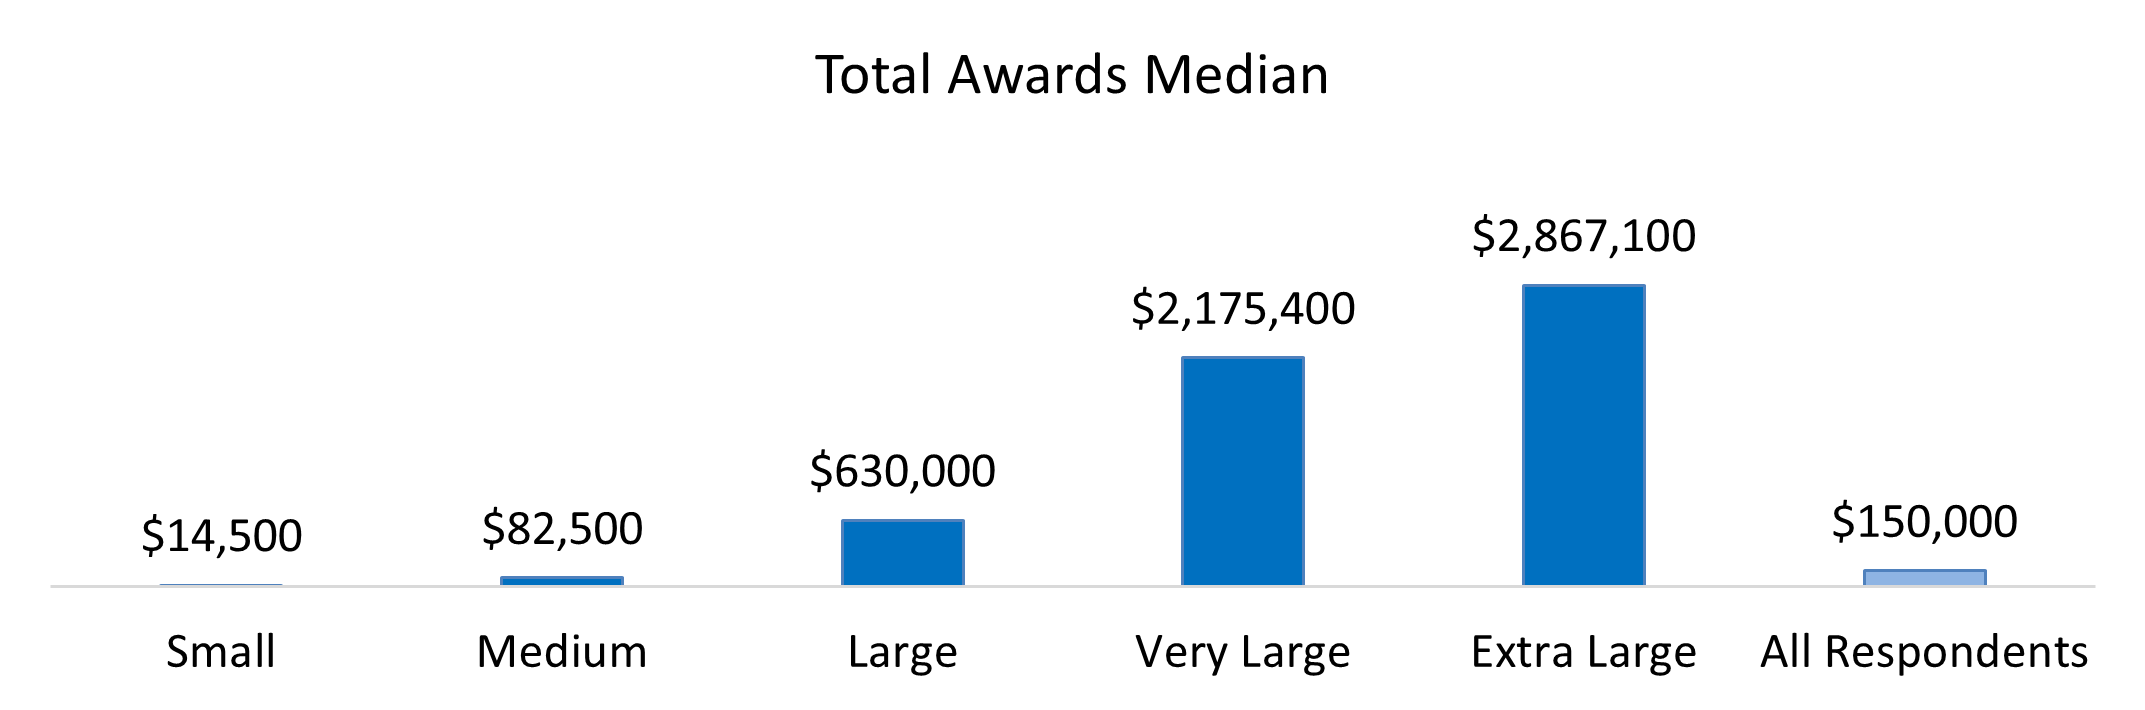
- Larger organizations consistently reported larger award sizes. Median total awards ranged from $14,500 for small organizations to over $2.8 million for extra-large organizations. The median size of the largest individual award ranged from $8,850 for small organizations to over $1.7 million for extra-large organizations.
- Extra-large organizations reported a much greater frequency of Federal government grants. Organizations should note that the median largest award size is substantially higher for government sources and consider these trends when setting realistic grantseeking expectations based on organizational size. For example, the median largest award for Federal grants was $423,435, while the median largest award from community foundations was $20,000.
Organization Mission Focus
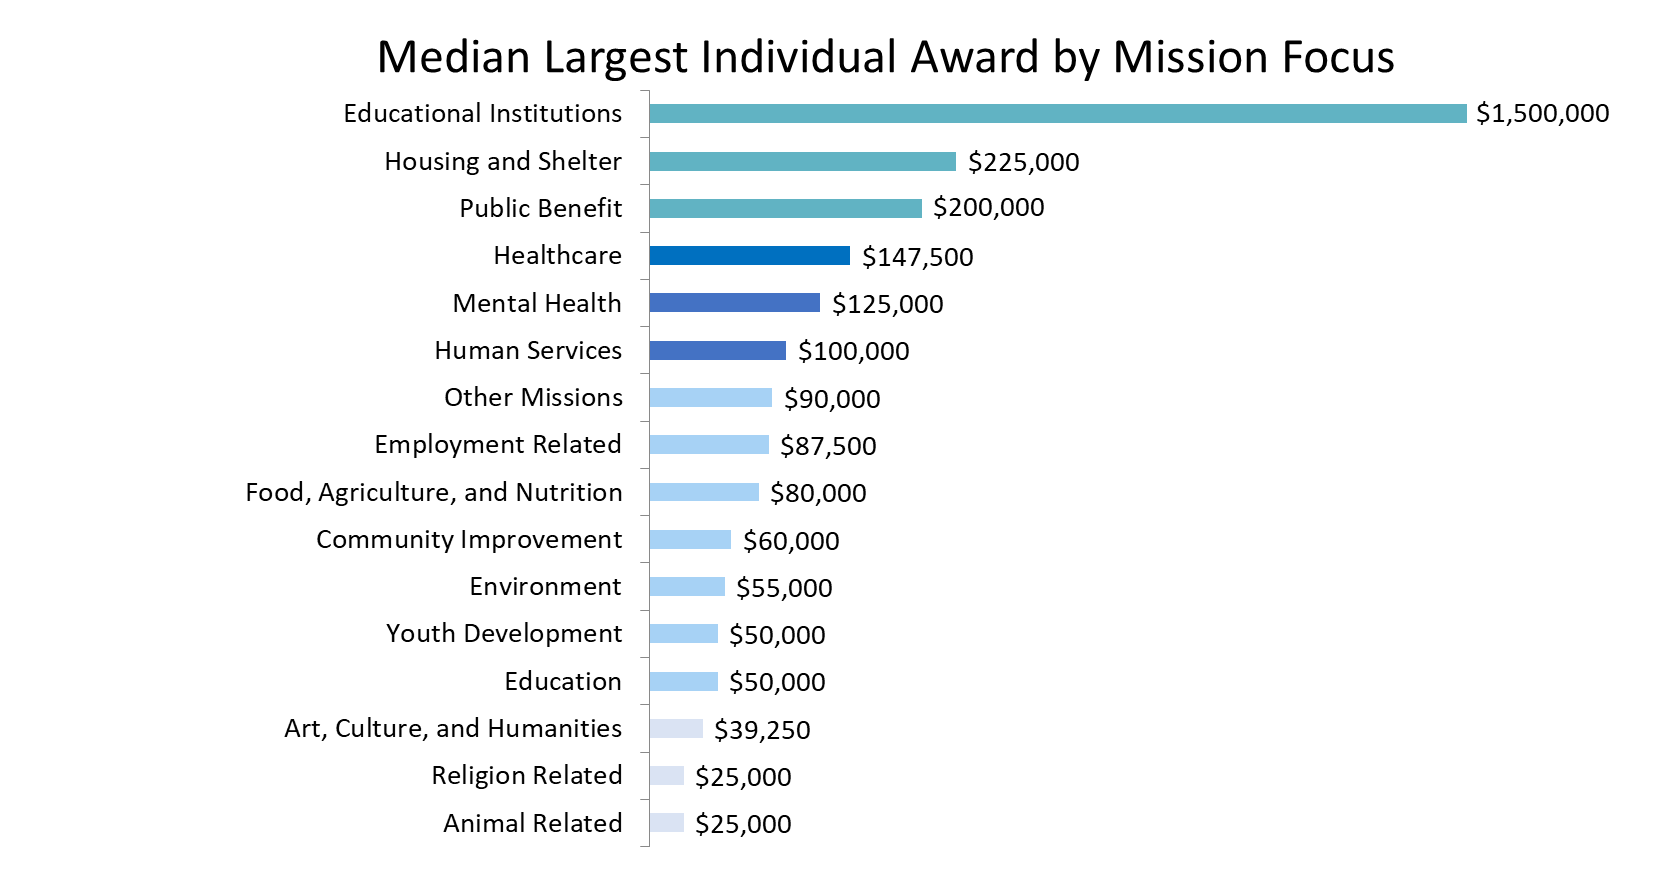
- Award sizes varied by organizational mission focus. The median size of the largest individual award ranged from $25,000 for Animal Related organizations to $1.5 million for Educational Institutions. Religion Related organizations reported a median award total of $48,500, while Educational Institutions reported a median award total of $2,549,015.
- Private foundations were the largest source of total grant funding for most mission focuses. The Federal government was the most frequently reported source of total grant funding for Educational Institutions and Housing and Shelter organizations.
Grantseeking Activity
Respondents to The 2023 State of Grantseeking™ Survey actively pursued grant funding for their organizations; 90% submitted at least one grant application in 2022.
Recent Activity
In 2022, 83% of respondents applied for the same number of grants (25%) or more grants (58%) than they did in 2021. Of respondent organizations, 77% were awarded the same number of grants (30%) or more grants (47%) compared to the prior year. Moreover, 78% of respondents reported that their organizations received awards of the same size (32%) or larger (46%).
Application and Award Rates by Funding Source
Application and award rates varied by funder type. Grantseekers most frequently applied to private foundations (91%), community foundations (85%), and corporate grantmakers (82%). Forty-eight percent of respondents reported applying to donor-advised funds. Among government funding sources, state government application rates (74%) were higher than those of local government (71%) or the Federal government (64%). Fifty-seven percent of respondents applied to “other” grant sources (including religious organizations, the United Way, civic organizations, other nonprofit organizations, and tribal funds).
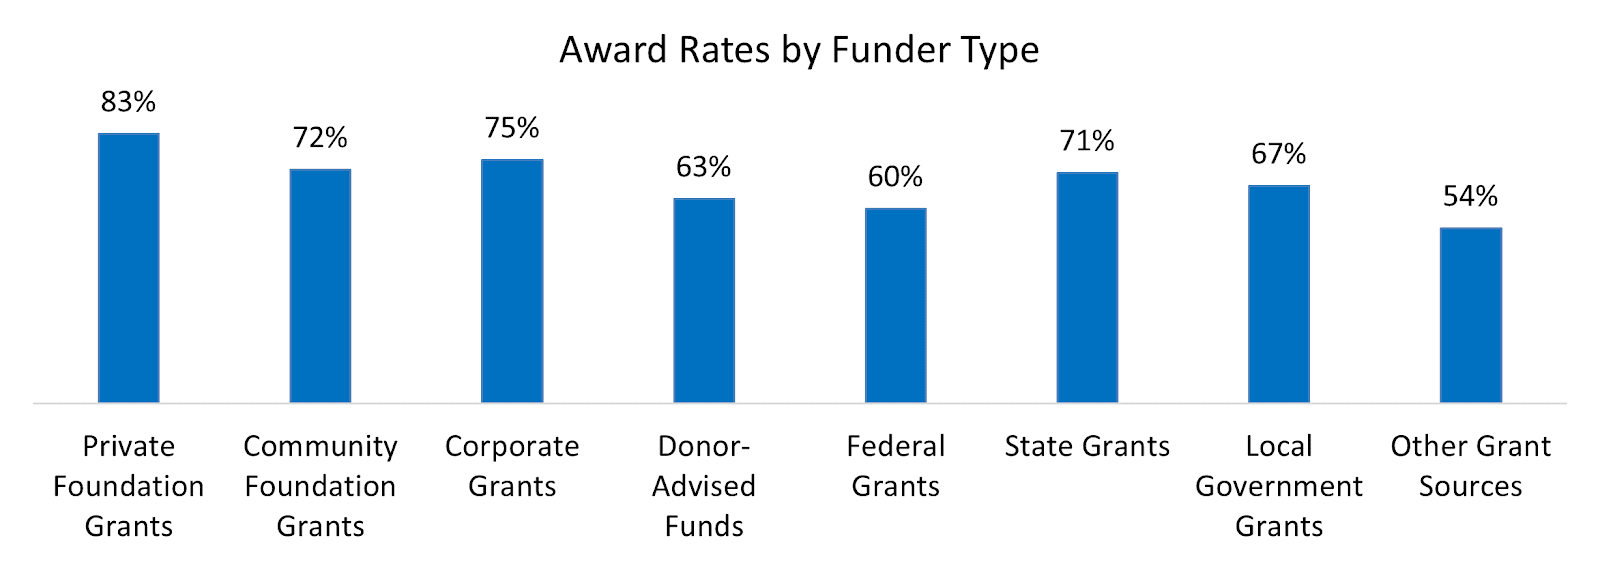
More frequent award rates were reported from private foundations (83%), community foundations (72%), and corporate grantmakers (75%). Sixty-three percent of respondents reported awards from donor-advised funds. Among government funding sources, state government (71%) and local government (67%) award rates were higher than those of the Federal government (60%). Awards from “other” grant sources (including religious organizations, the United Way, civic organizations, other nonprofit organizations, and tribal funds) were reported at a rate of 54%.
Number of Grant Applications
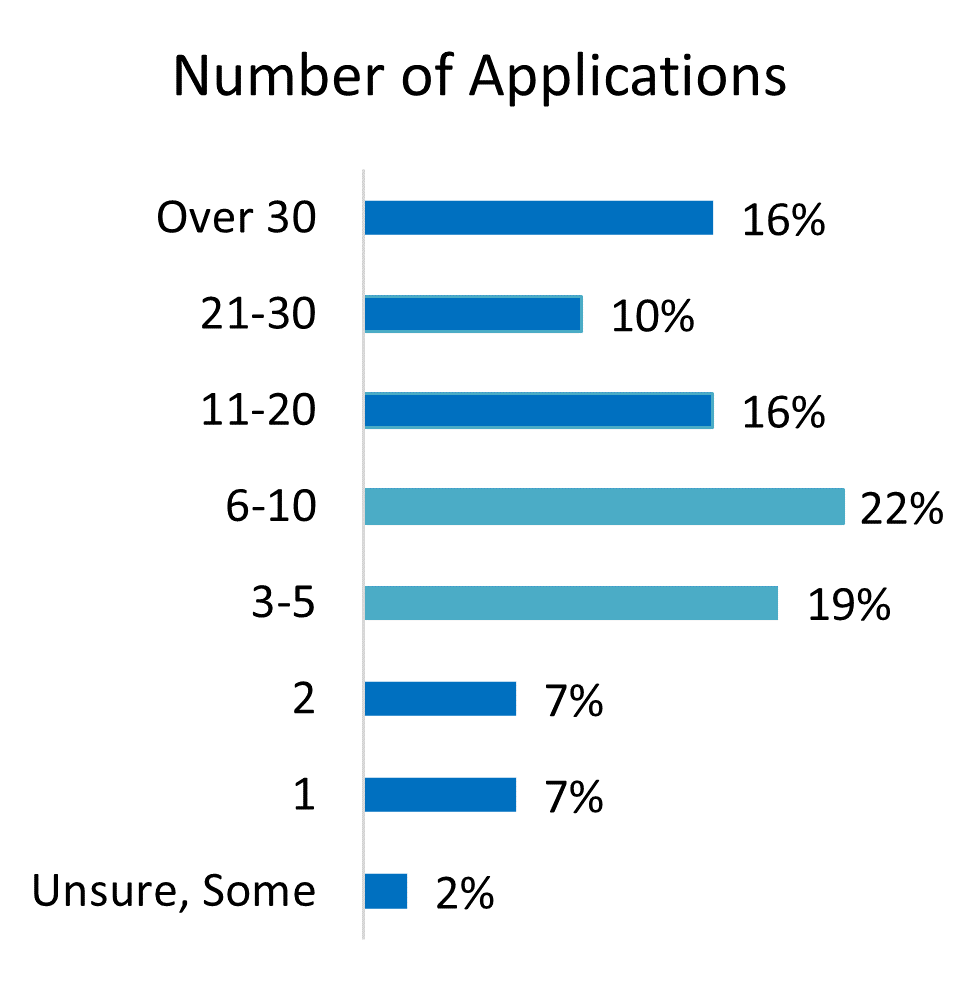
Most respondents (90%) applied for grant funding in 2022. Of those respondents that submitted a grant application during that time, 41% submitted between three and 10 applications. One or two grant applications were submitted by 14% of respondents. Sixteen percent of respondents submitted between 11 and 20 grant applications, and 10% submitted between 21 and 30 applications. Thirty-one or more grant applications were submitted by 16% of respondents. Two percent of respondents reported submitting some applications, of indeterminate quantity.
Number of Grant Awards
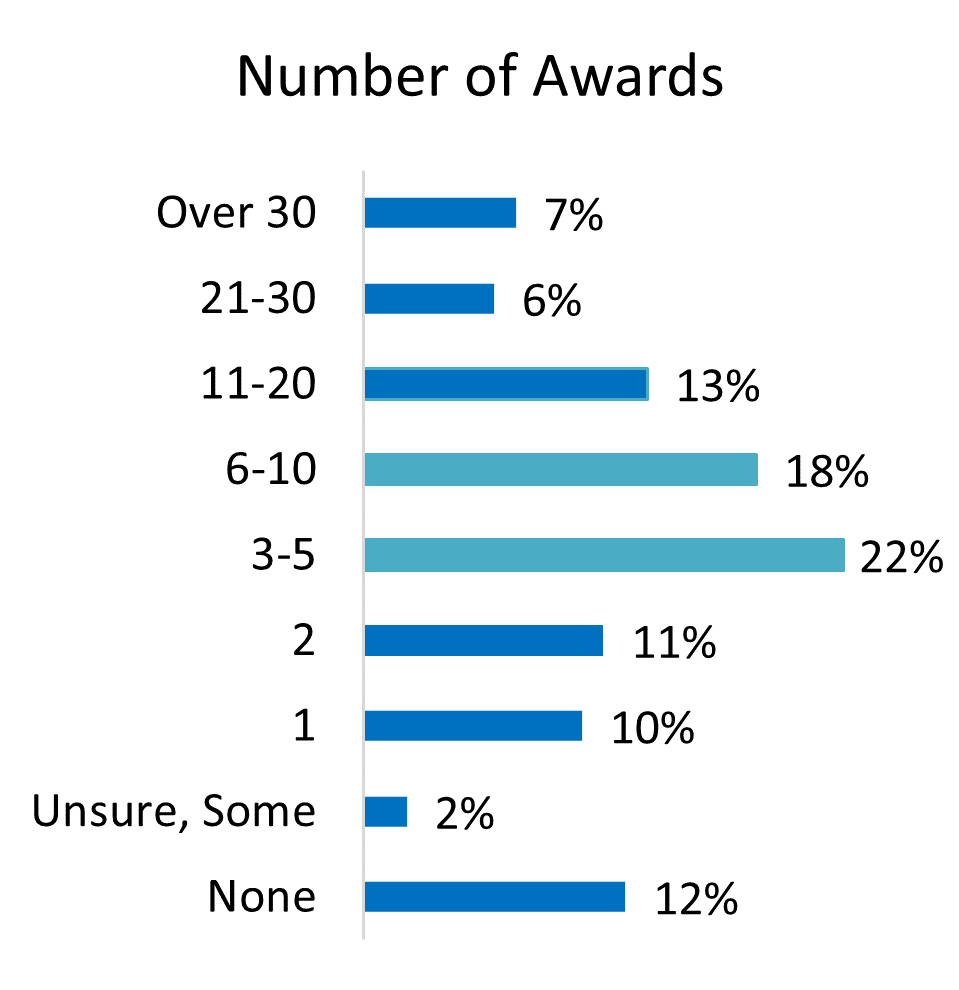
During 2022, a total of 88% of respondents received at least one grant award. Twenty-one percent of respondents received one or two grant awards and 40% received between three and ten grant awards. Nineteen percent of respondents received between eleven and thirty grant awards, while 7% reported receiving over thirty awards. Two percent of respondents received awards but were unsure of the exact number, whereas 12% of respondents reported receiving no awards.
Grant Applications vs. Grant Awards
The relationship between applications submitted and awards won can be seen in the chart below. A larger number of applications was more likely to result in a larger number of awards. Some awards received in 2022 resulted from applications submitted at an earlier time, and some applications were submitted for which awards had not yet been determined.
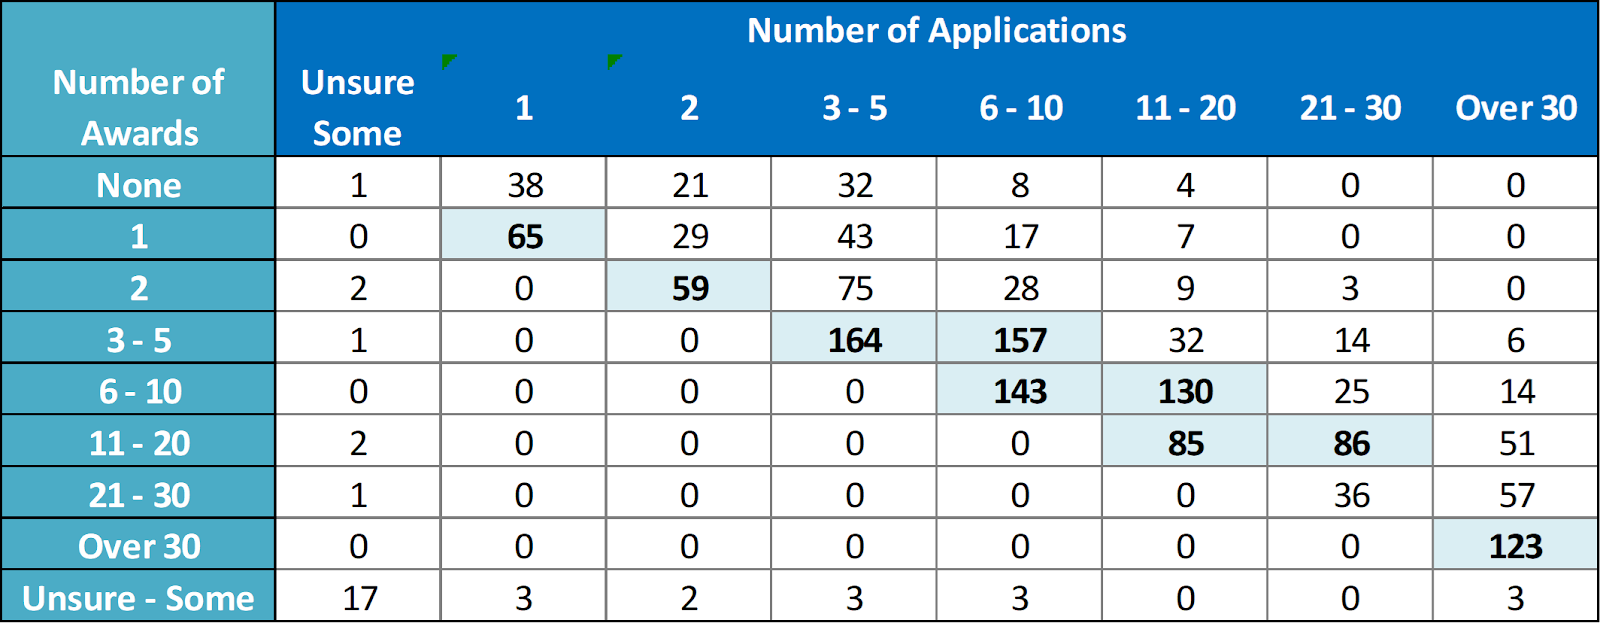
- One Application: 64% of respondents were awarded at least one grant.
- Two Applications: 81% of respondents were awarded at least one grant.
- Three to Five Applications: 90% of respondents were awarded at least one grant; 75% of respondents were awarded two to five grants.
- Six to Ten Applications: 98% of respondents were awarded at least one grant; 84% of respondents were awarded three to ten grants.
- 11 to 20 Applications: 99% of respondents were awarded at least one grant; 81% of respondents were awarded six to 20 grants.
- 21 to 30 Applications: 100% of respondents were awarded at least one grant; 74% of respondents were awarded 11 to 30 grants.
- Over 30 Applications: 100% of respondents were awarded at least one grant; 91% of respondents were awarded 11 to 30 grants.
Applying for at least three grant awards increases the frequency of winning an award. Applying for at least six grant awards almost ensures winning at least one award.
Grant Funding Sources
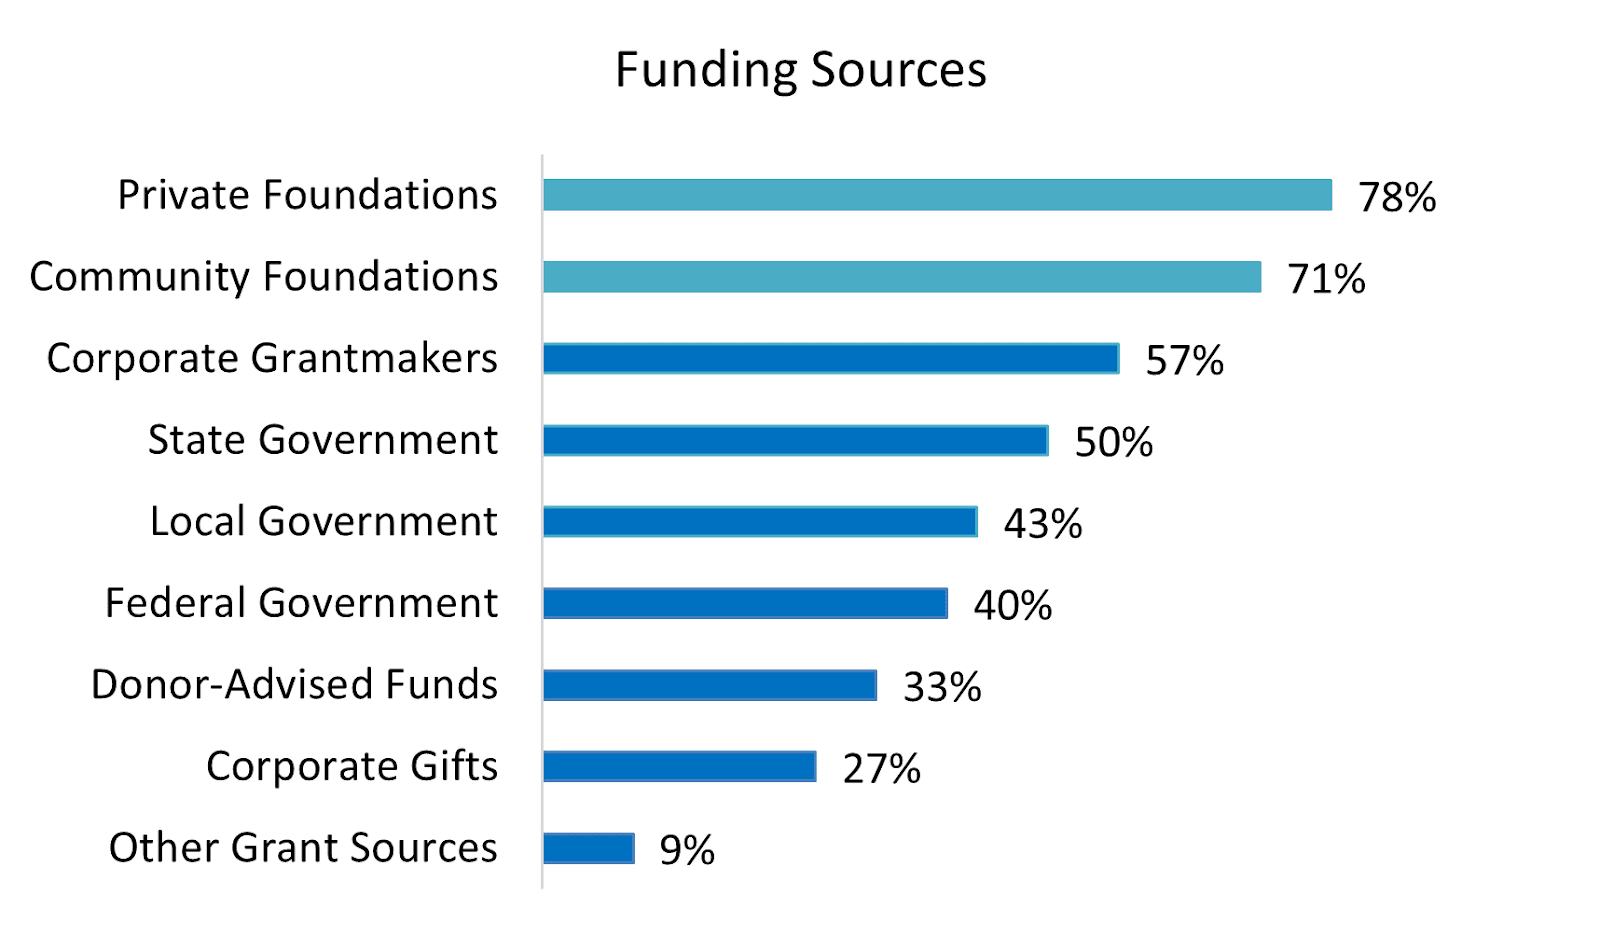
Private foundations (78%), community foundations (71%), and corporations (57%) were the most frequently cited sources of grant awards. Donor-advised funds were a source of funding for 33% of respondents, while corporate gifts of products or services were reported by 27% of respondents. Among government funders, state funding sources (50%) were reported more frequently than local (43%) and Federal (40%) funding sources. Other funding sources (including religious organizations, the United Way, civic organizations, other nonprofit organizations, and tribal funds) were reported by 9% of respondents.
Staff
Organizational staff were the primary grantseekers for 70% of respondents. Board members (10%), volunteers (7%), and contract grant specialists (10%) were also cited as the primary grantseeker. Three percent of respondent organizations were not engaged with active grantseekers.
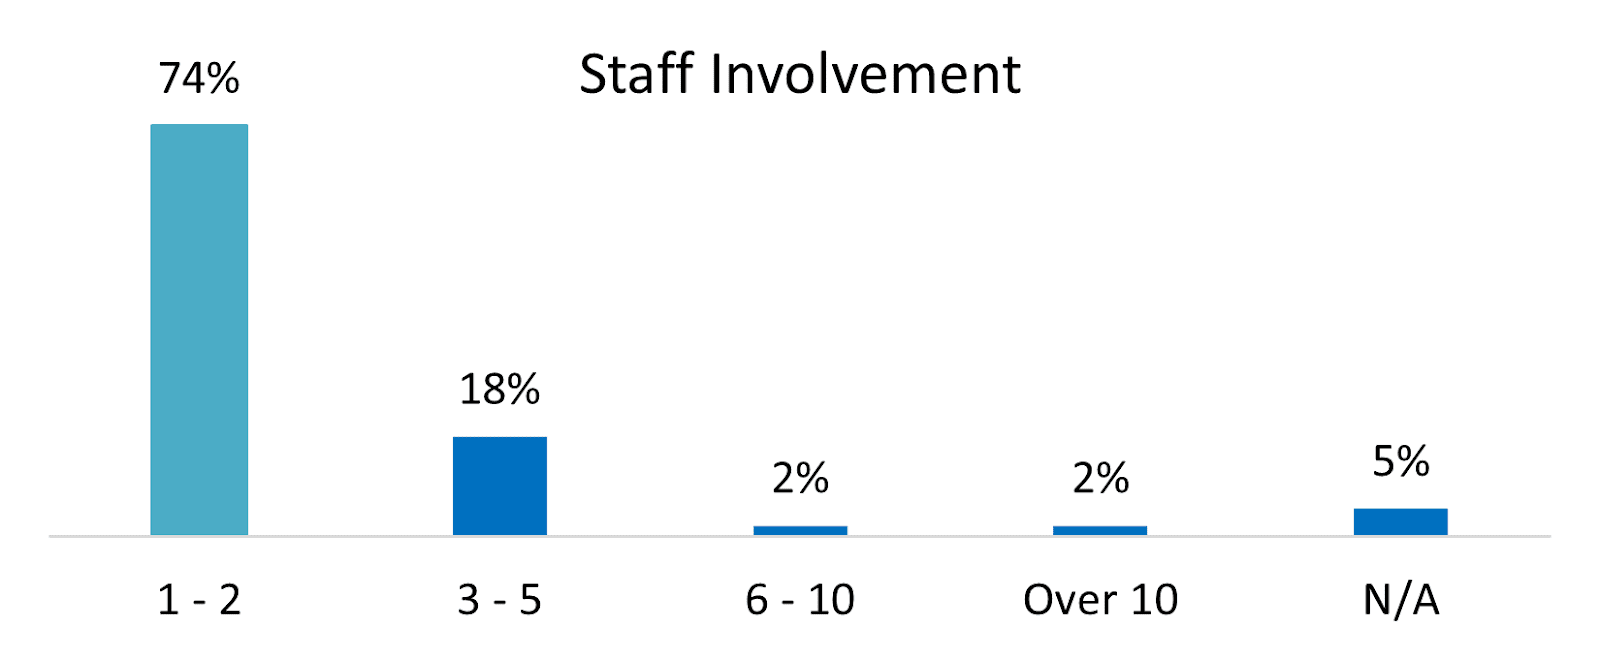
Among those organizations with active grantseekers, 74% reported that one to two people were directly involved with the grant process. Three to five grantseekers were reported by 18% of respondents. Larger grant staff sizes of six to ten people (2%) and over ten people (2%) were also reported. Five percent of respondents said they did not have active grantseekers at their organizations.
Total Funding
Total Grant Funding Budget Contribution
Grant funding was 10% or less of the annual budget for 31% of respondents, and 11% to 25% of the budget for 20% of respondents. Grant funding comprised 26% to 50% of the budget for 20% of respondents, and 51% to 75% of the budget for 15% of respondents. Fifteen percent of respondents reported grant funding of 76% or more.
Total Grant Funding
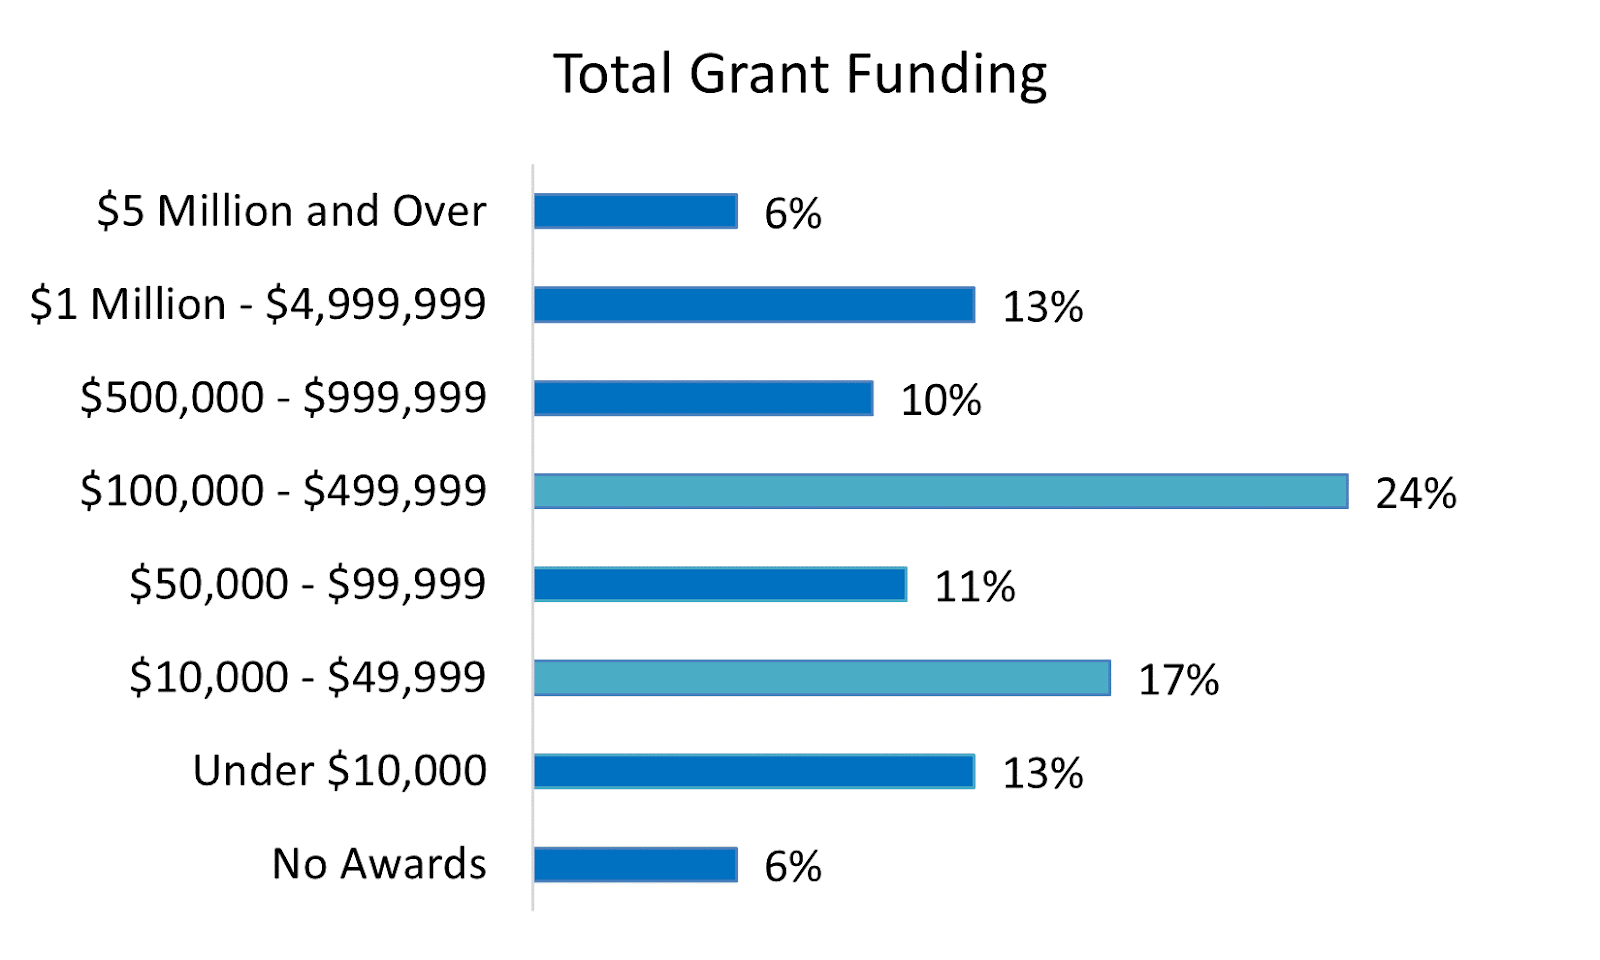
Total awards under $10,000 were reported by 13% of respondents, while 17% reported total awards between $10,000 and $49,999. Eleven percent of respondents reported total grant awards between $50,000 and $99,999, whereas 24% of respondents reported total awards of $100,000 to $499,999. Total awards between $500,000 and $999,999 were reported by 10% of respondents, while 13% reported total awards of $1 million to $4,999,999. Six percent of respondents reported total awards of $5 million or more. The median value of total awards was $150,000 and the average value of total awards was $2,654,037.
Recurring Grants
Recurring grants (a fixed grant award which takes place on an ongoing basis) comprised 10% or less of total grants for 45% of respondents, and 11% to 25% of total grants for 16% of respondents. Recurring grant funding comprised 26% to 50% of total grants for 17% of respondents, and 51% to 75% of the grant budget for 14% of respondents. Nine percent of respondents reported recurring grant funding of 76% or more.
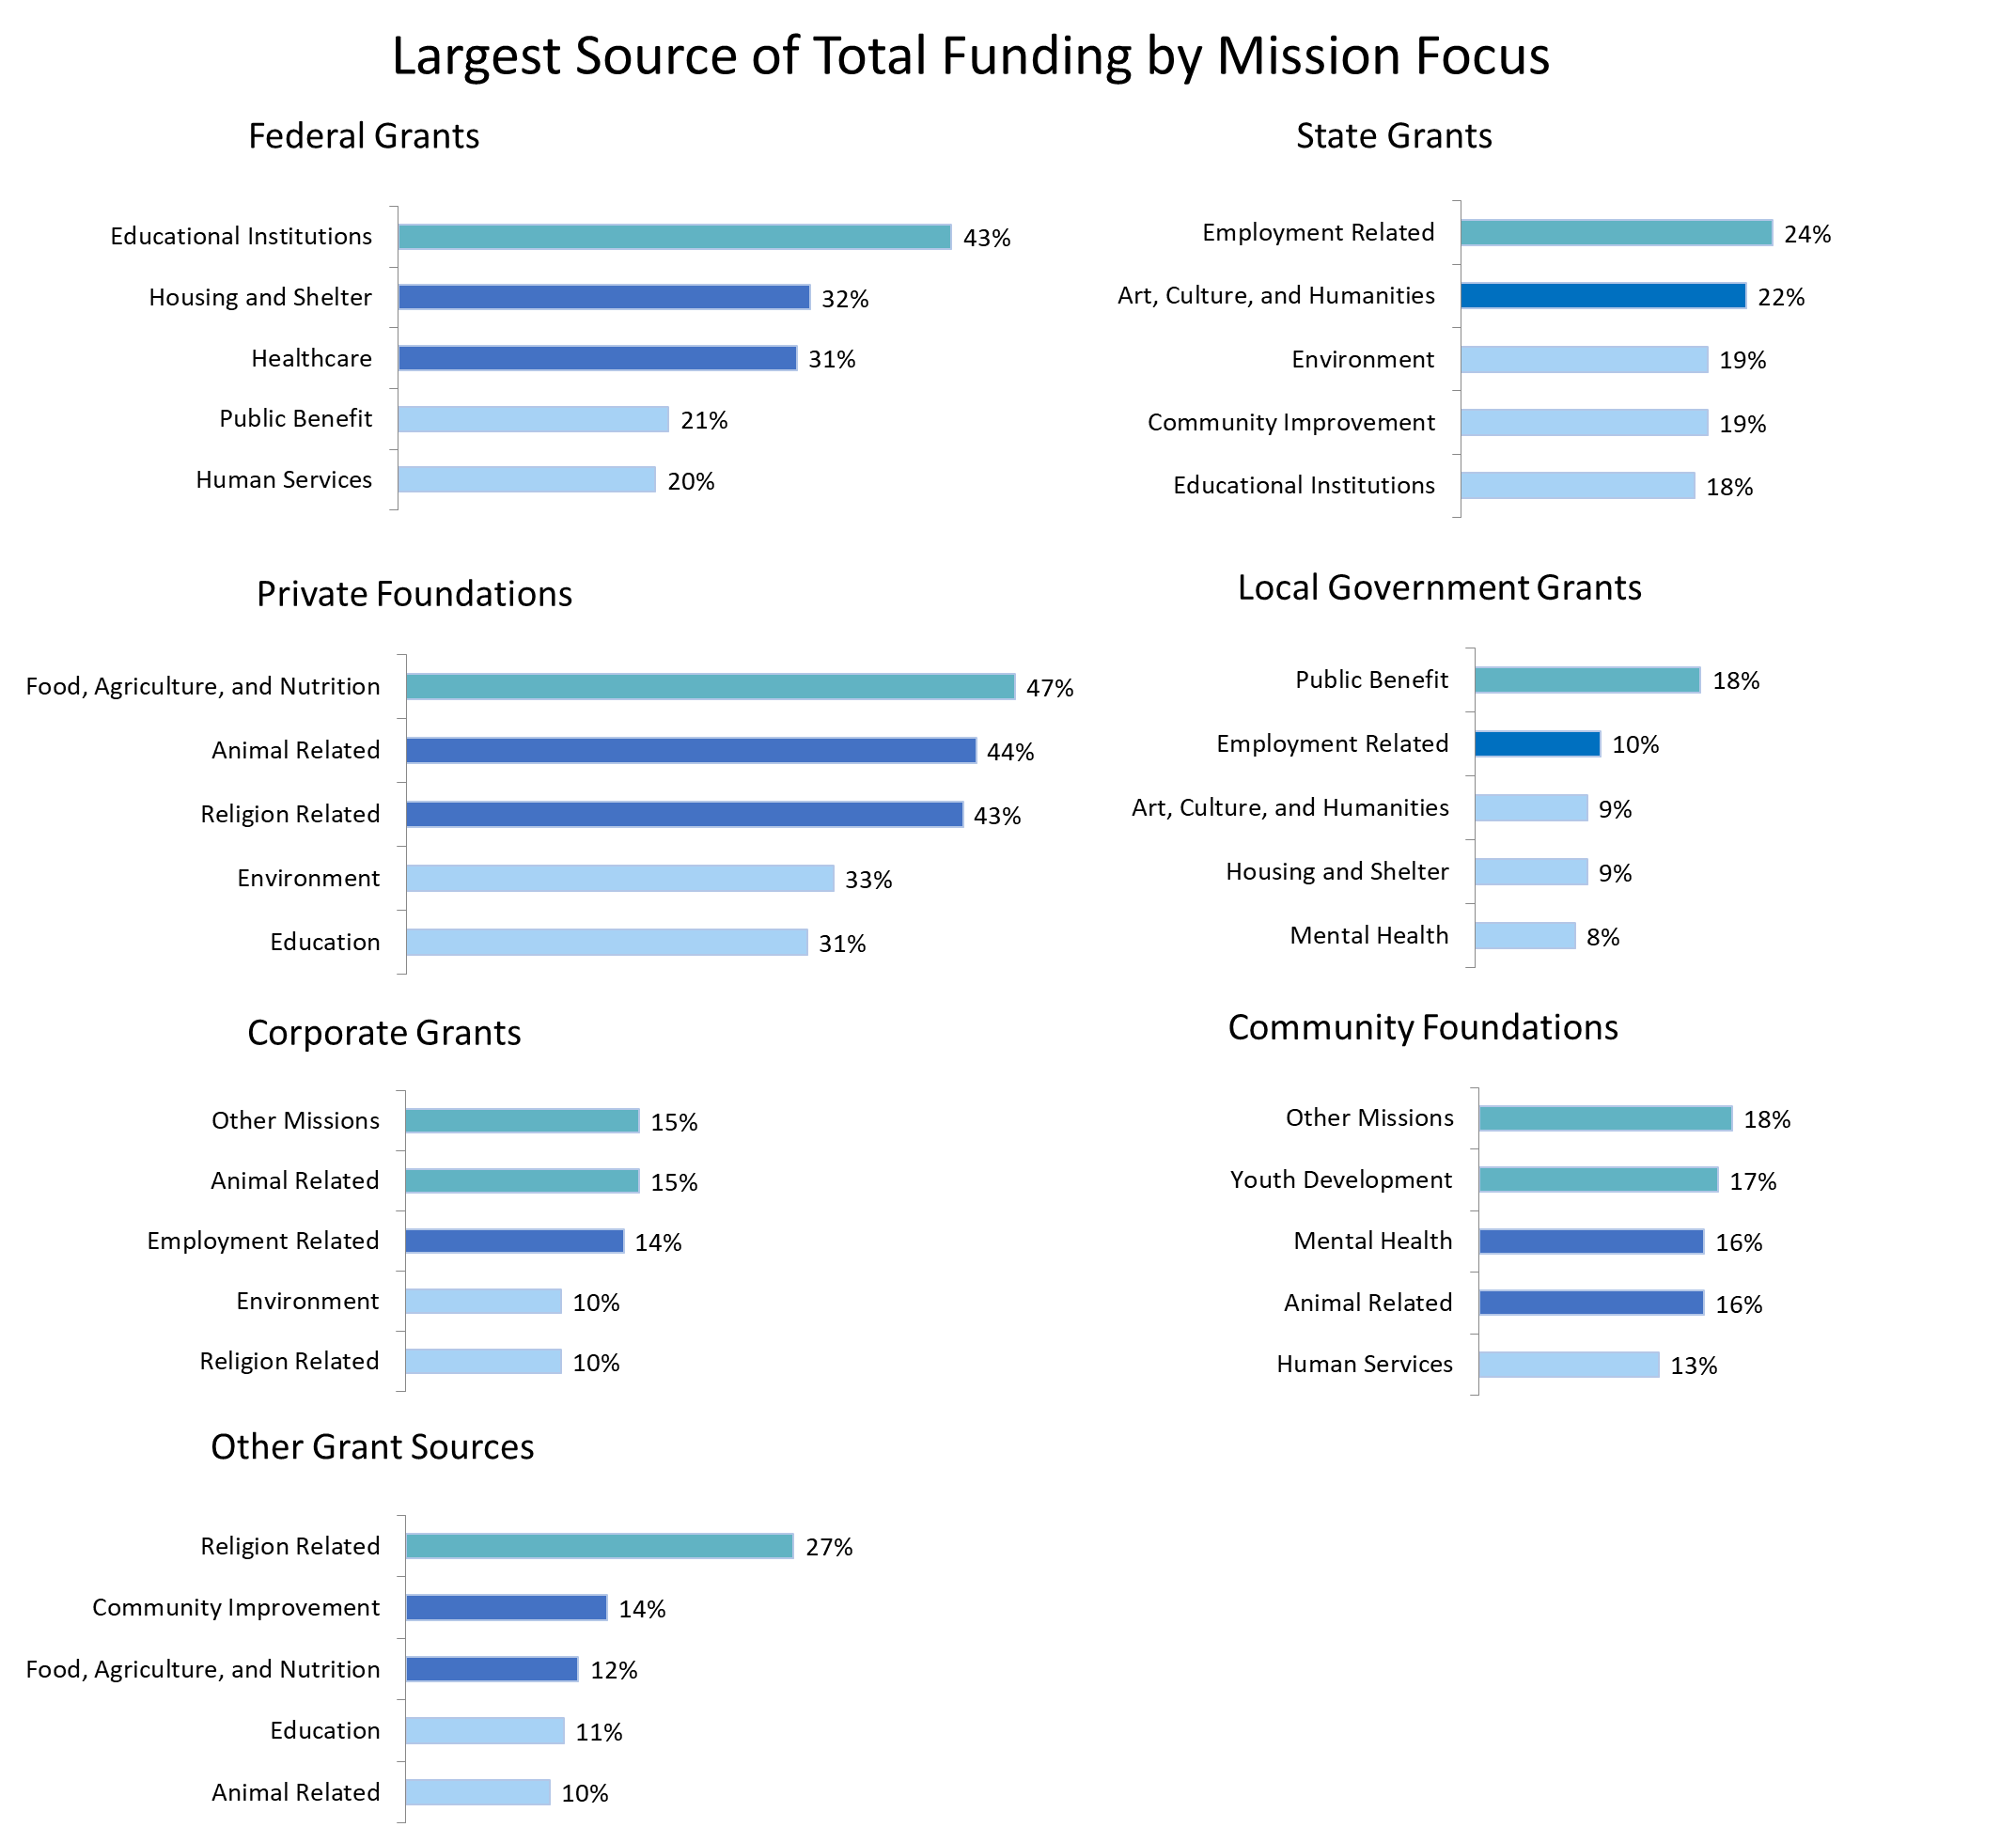
Largest Source of Total Funding
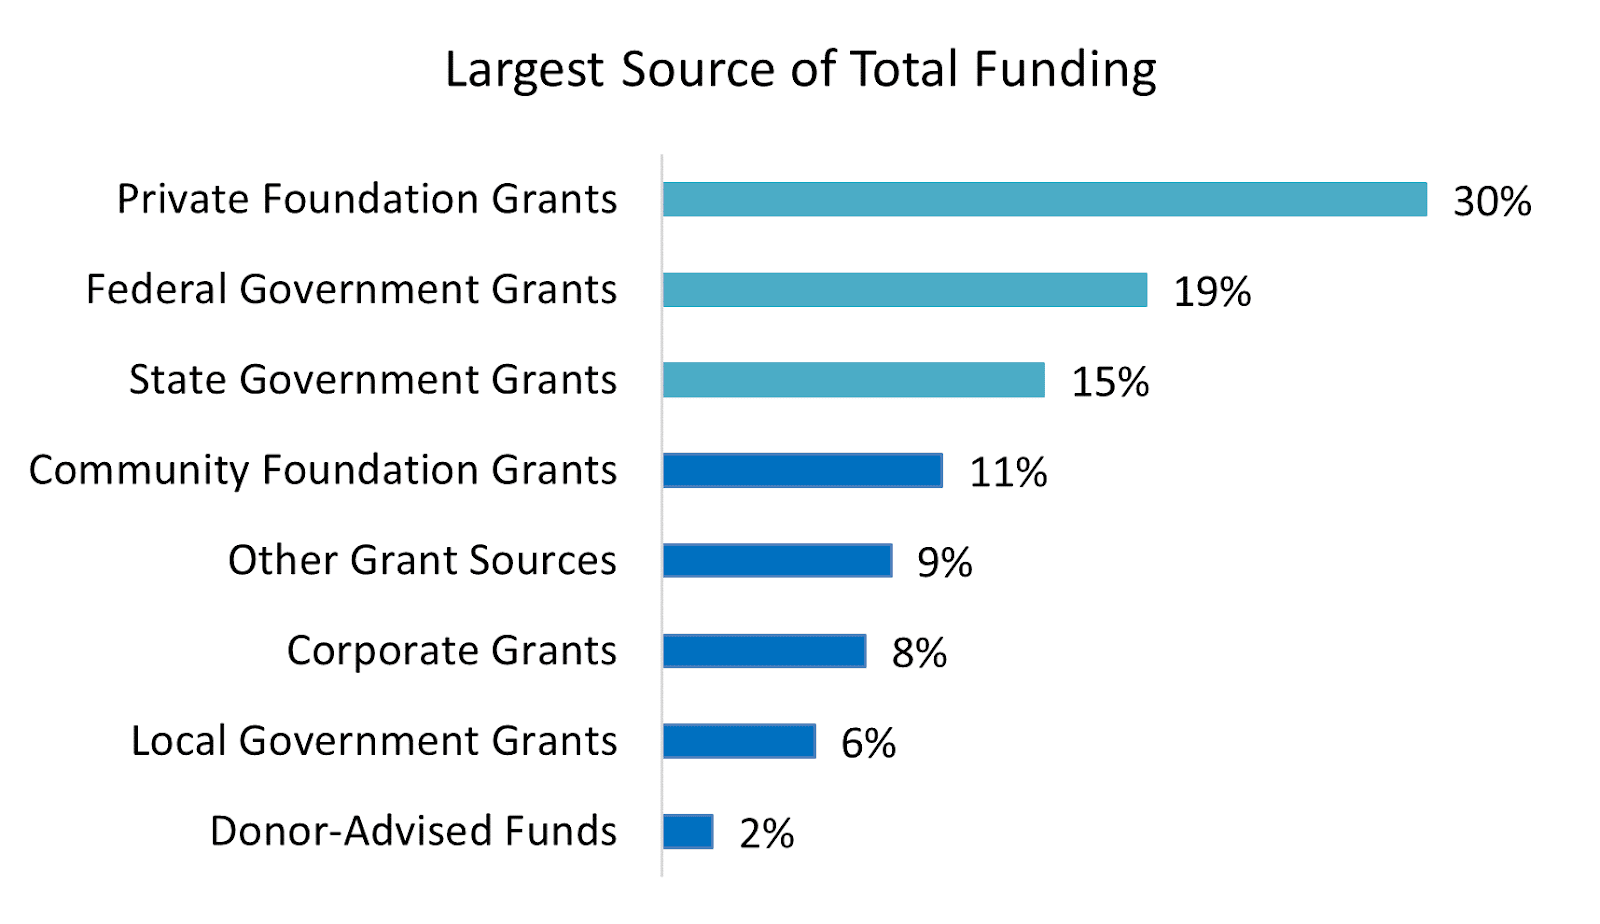
Private foundations (30%) were the most frequently reported largest source of total grant funding, followed by the Federal government (19%) and state government (15%). Community foundations were the largest source of total funding for 11% of respondents. Eight percent of respondents reported corporate grants as the largest source of total funding, while 6% reported local government as the largest total funding source. Donor-advised funds were the largest source of total funding for 2% of respondents. “Other” grant sources (including religious organizations, the United Way, civic organizations, other nonprofit organizations, and tribal funds) were the largest source of total funding for 9% of respondents.
Largest Awards
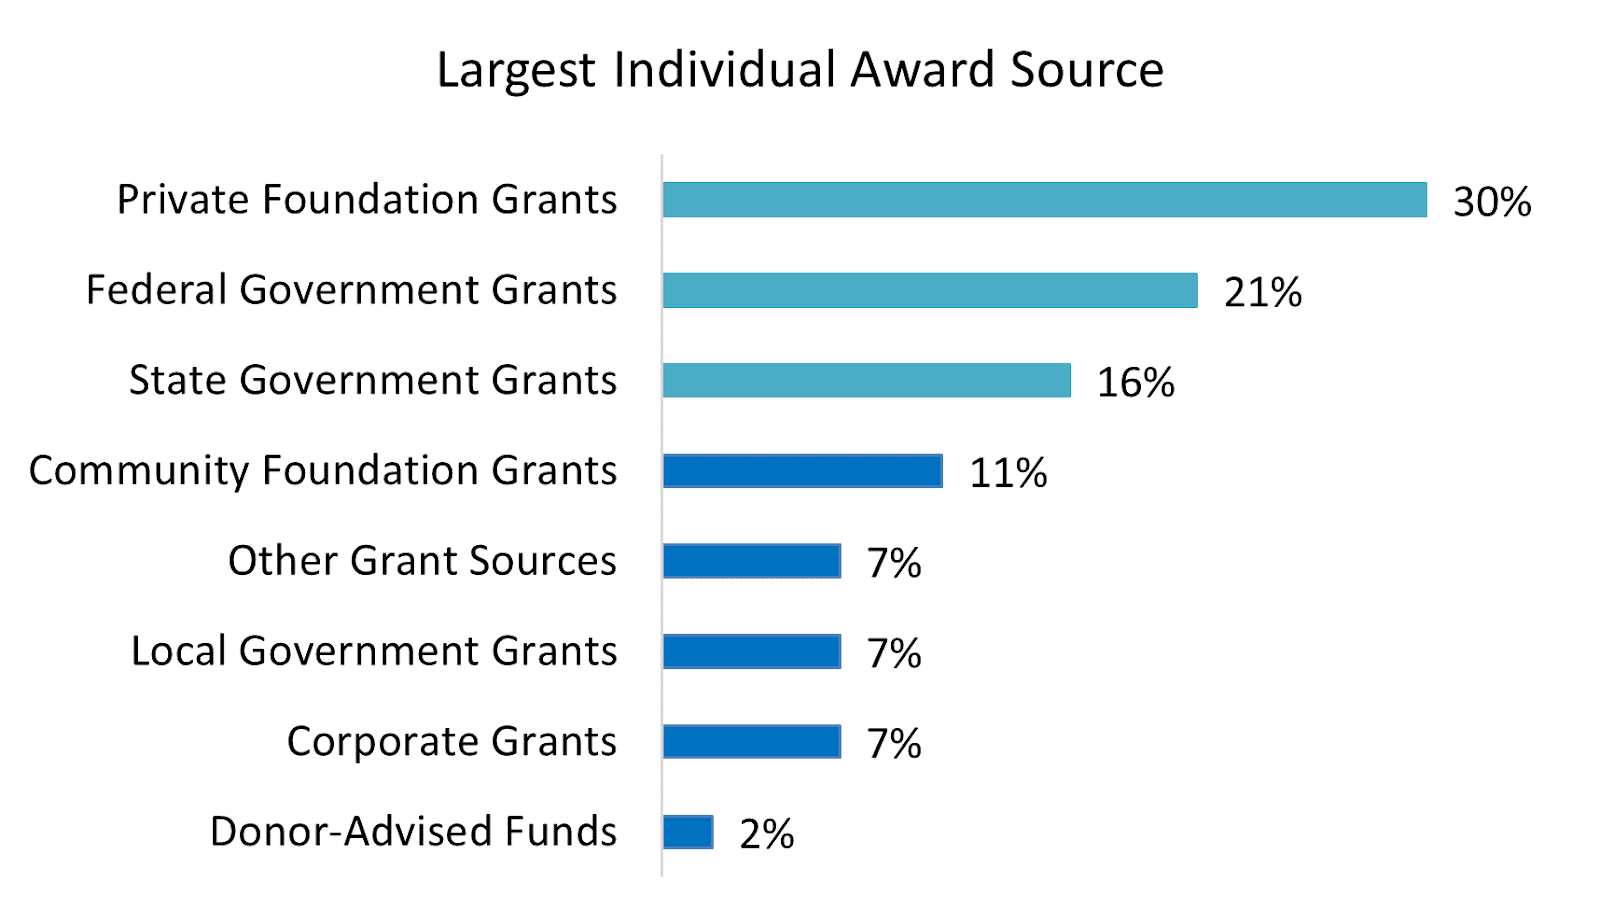
Largest Individual Award Source
Private foundations (30%) were the most frequently reported source of the largest individual grant award. For 21% of respondents, the Federal government was the source of the largest individual grant award. State government was the largest individual award source for 16% of respondents, followed by community foundations (11%), local government (7%), and corporate grants (7%). Donor-advised funds were the largest source of total funding for 2% of respondents. Seven percent of respondents reported “other” grant sources (including religious organizations, the United Way, civic organizations, other nonprofit organizations, and tribal funds) as their largest individual award source.
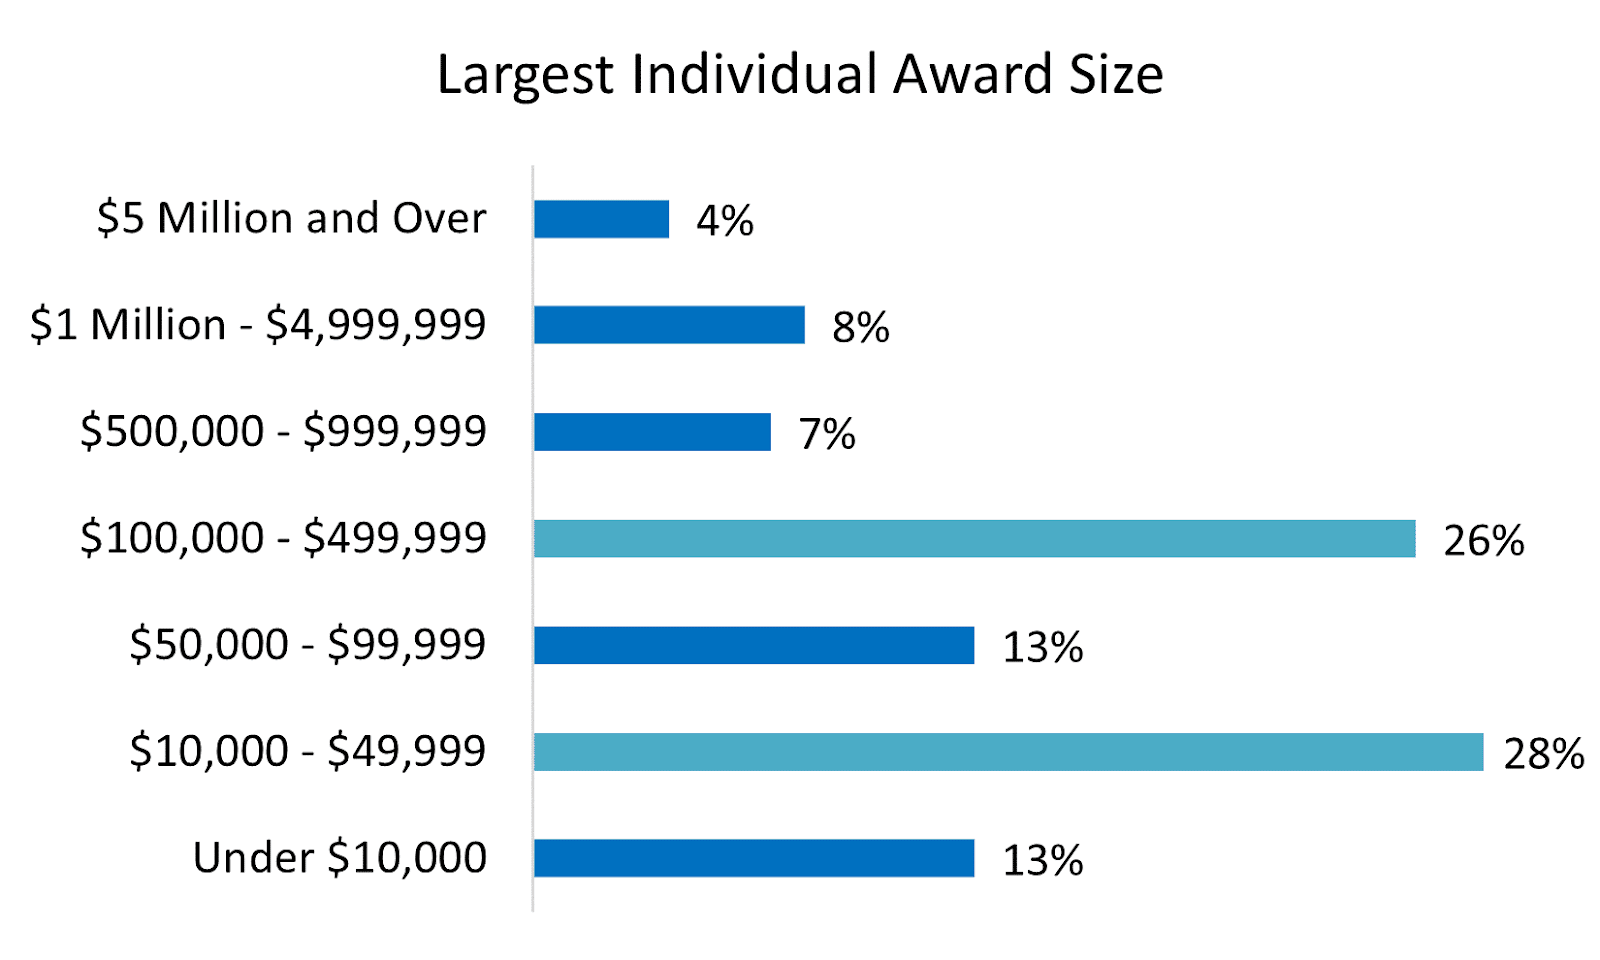
Largest Award Size
The median largest individual award for all respondents was $74,500 and the average largest individual award was $1,049,425.
Eighty percent of respondents reported a largest individual award of under $500,000. A largest individual award of under $10,000 was reported by 13% of respondents, while 28% reported a largest individual award of $10,000 to $49,999. Thirteen percent of respondents reported a largest individual award between $50,000 and $99,999, whereas 26% of respondents reported a largest individual award of $100,000 to $499,999. A largest individual award between $500,000 and $999,999 was reported by 7% of respondents, while 8% reported a largest individual award of $1 million to $4,999,999. Four percent of respondents reported a largest individual award of $5 million or more.
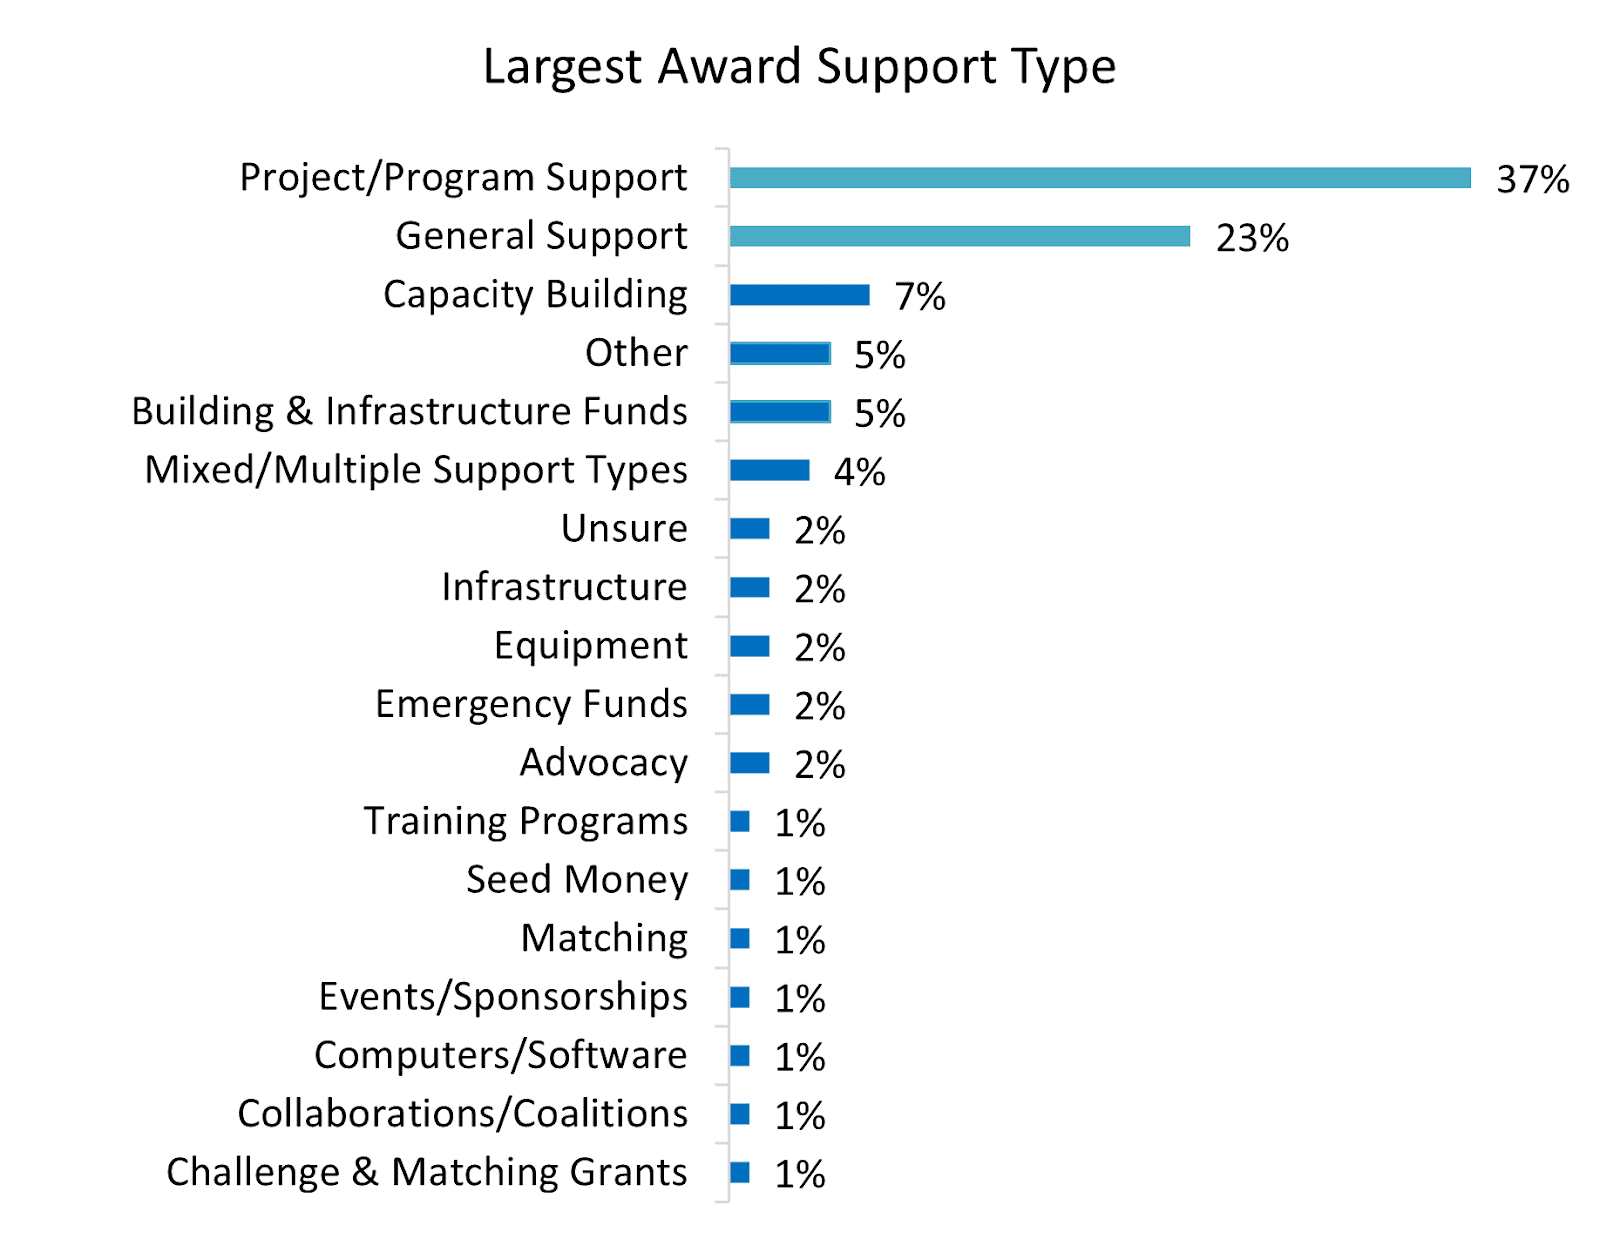
Largest Award Support Type
Of the 25 types of support, project or program support (37%) and general support (23%) were reported most frequently. The “other” category is comprised of the seven support types with less than 1% of responses.
Largest Award Logistics
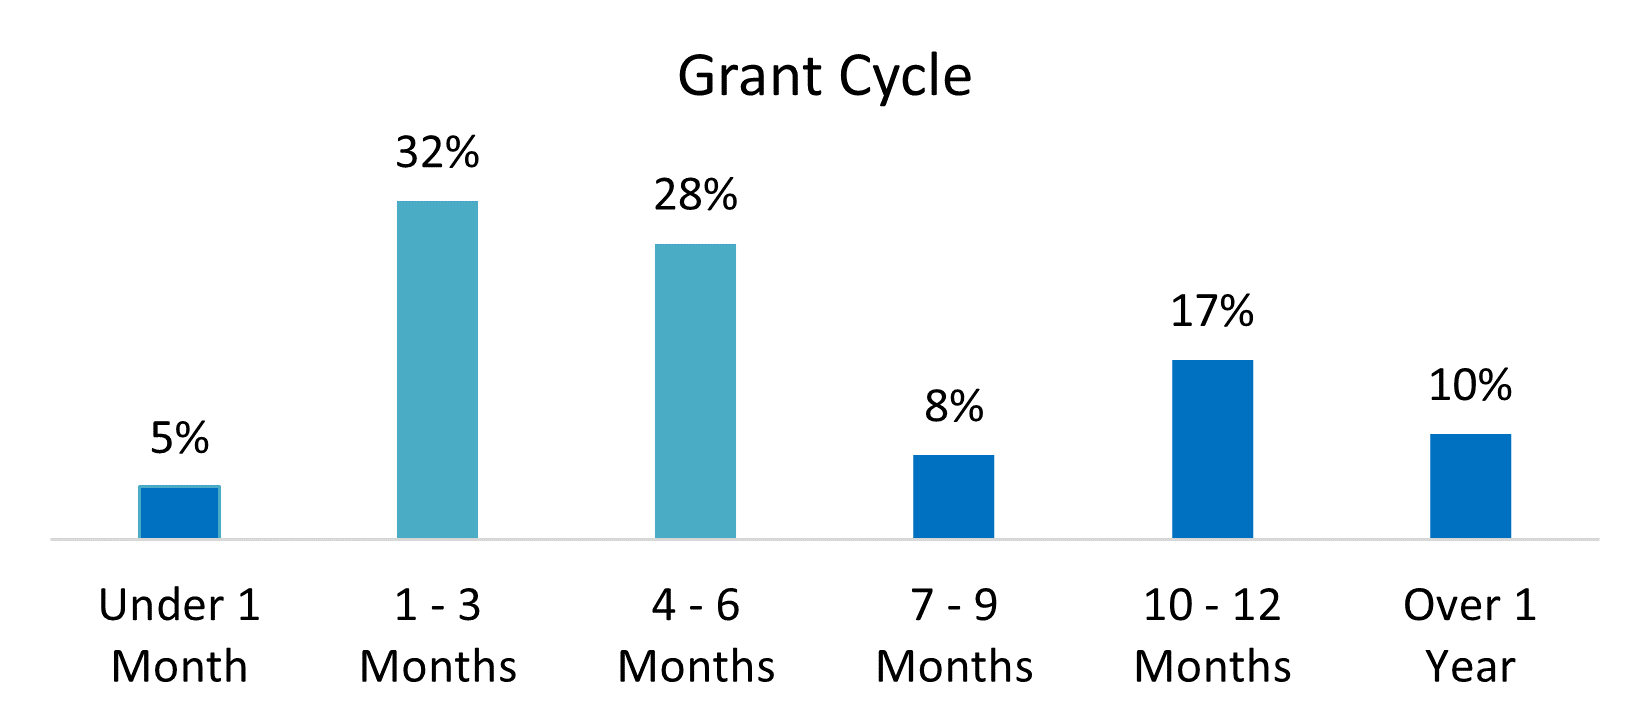
Grant Cycle
The grant cycle length—from proposal submission to award decision—for the largest grant award was between one and six months for 60% of respondents. A longer grant cycle of seven months or more was reported by 35% of respondents, while 5% reported a shorter grant cycle of less than a month.
Staff Involvement
For 66% of respondents, one to two people were directly involved in the grantseeking process for the largest individual award. Twenty-two percent of respondents reported that three to five people were directly involved, and 5% reported that six or more people were directly involved. Seven percent of respondents reported no direct staff involvement.
Time Allocation
When combined, the various facets of a grant application involve days to weeks of work. For the largest individual award, we asked respondents to tell us how much time was spent on research to support the statement of need, project design, writing the proposal, coordination of the attachments and submission, reporting, and post-award monitoring. Research (66%), project design (53%), submission (68%), and reporting (54%) took three days or fewer for the majority of respondents. However, writing the grant application took more than three days for 54% of respondents. Post-award monitoring wasn’t applicable for 22% of respondents and took three days or fewer for 40% of respondents.
Award Cycle
Once an award decision had been determined, funders released the award monies quickly; 70% of respondents reported receiving the award within three months of notification. Delayed receipt of award monies, taking four months or more, was reported by 30% of respondents.
GOVERNMENT FUNDING
Government Funding Sources
Among those respondents that reported government funding sources, state government (50%) was most frequently reported as a government funding source, followed by local government (43%) and the Federal government (40%).
Government largest source of total funding
Among government award recipients, the Federal government (42%) was most frequently reported as the largest source of total funding, followed by state government (35%), and local government (14%). Nine percent of government award recipients reported non-government funders as their largest source of total funding.
Government largest individual award source
Among those respondents that reported government funding sources, the Federal government (47%) was most frequently reported as the largest individual award source, followed by state government (37%) and local government (16%).
Government Grant Cycle
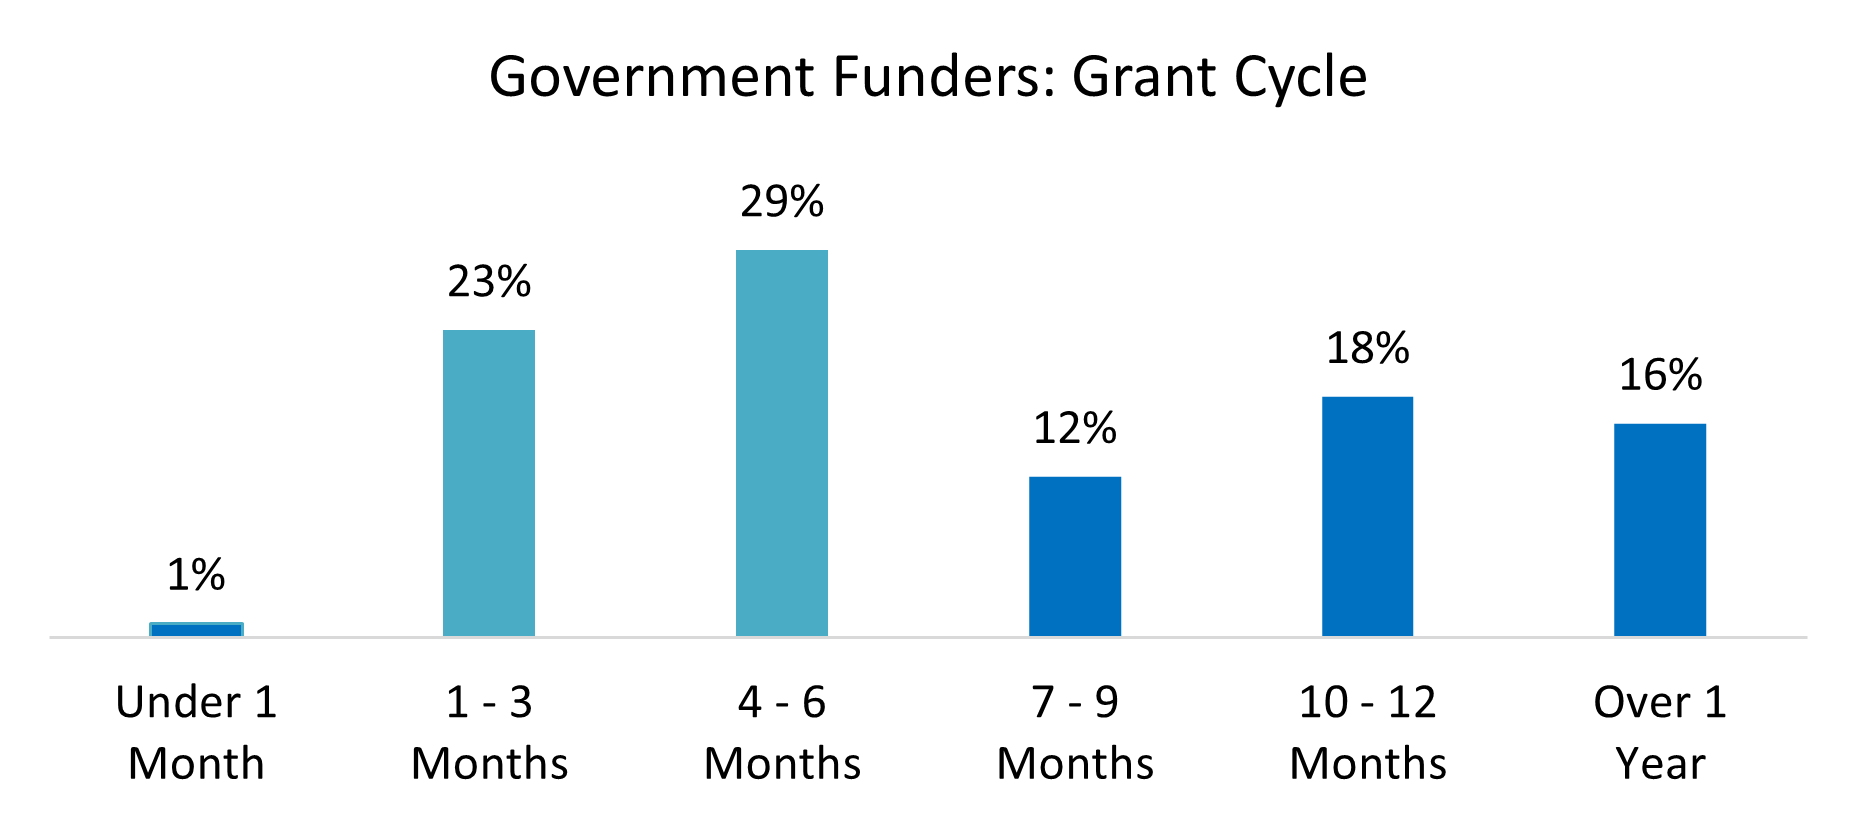
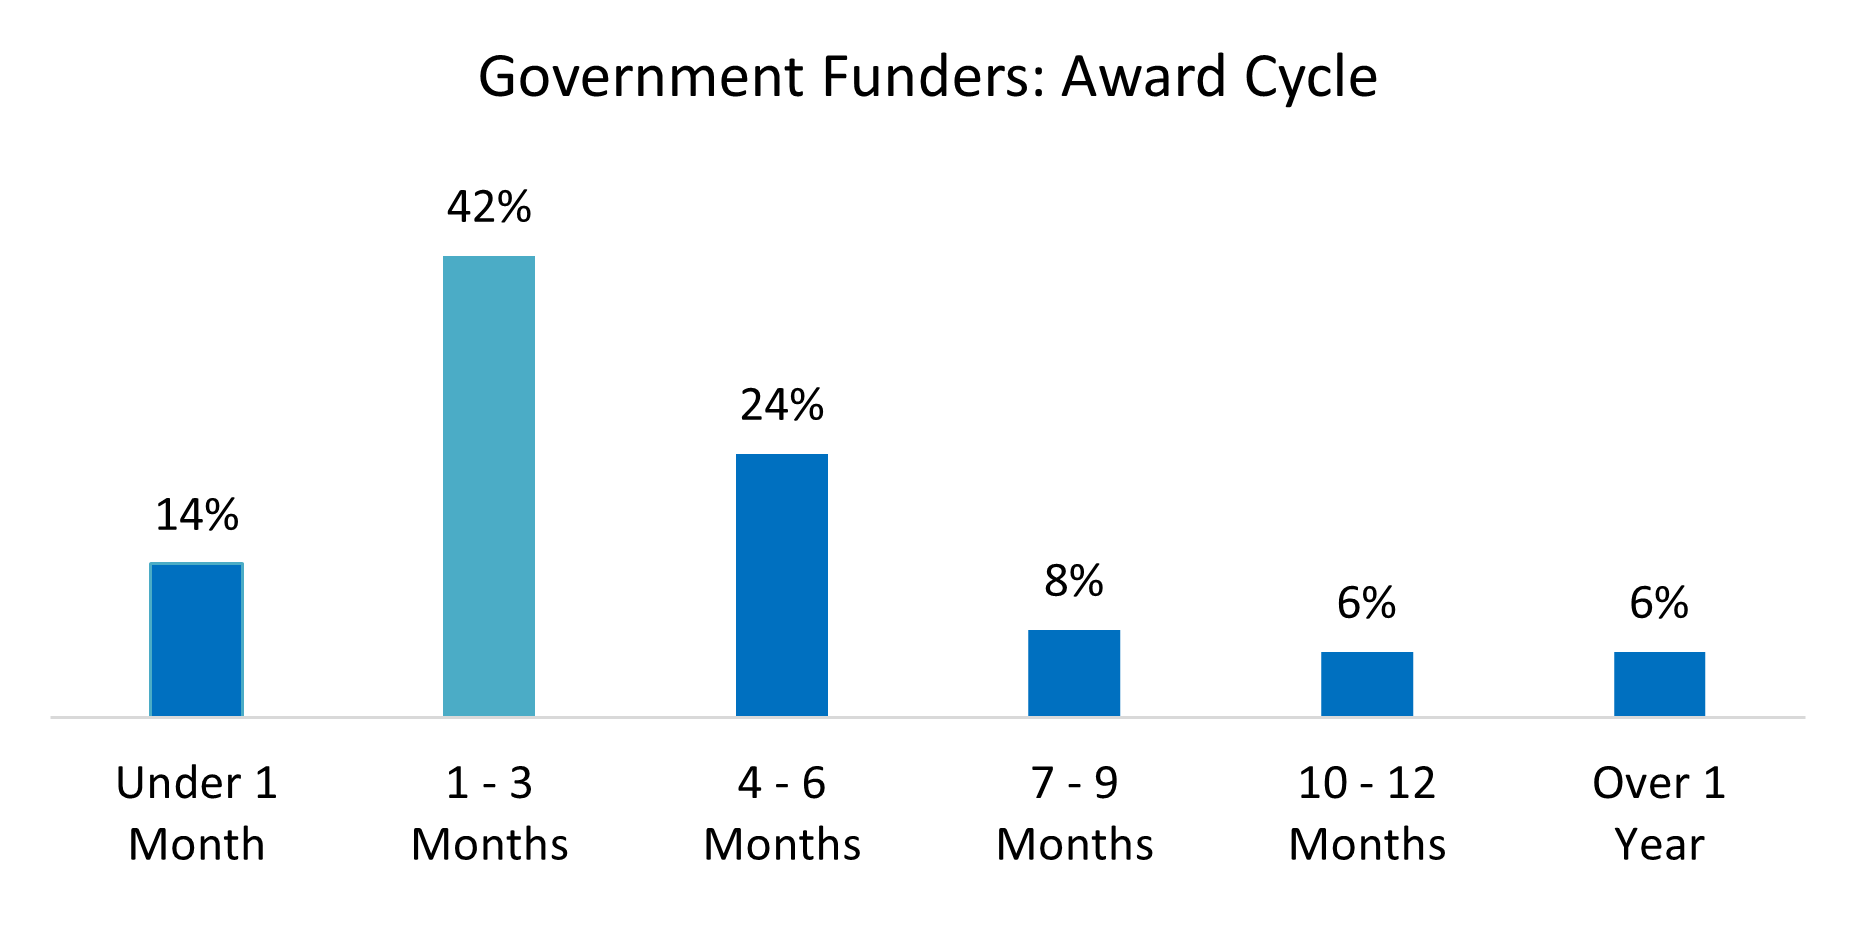
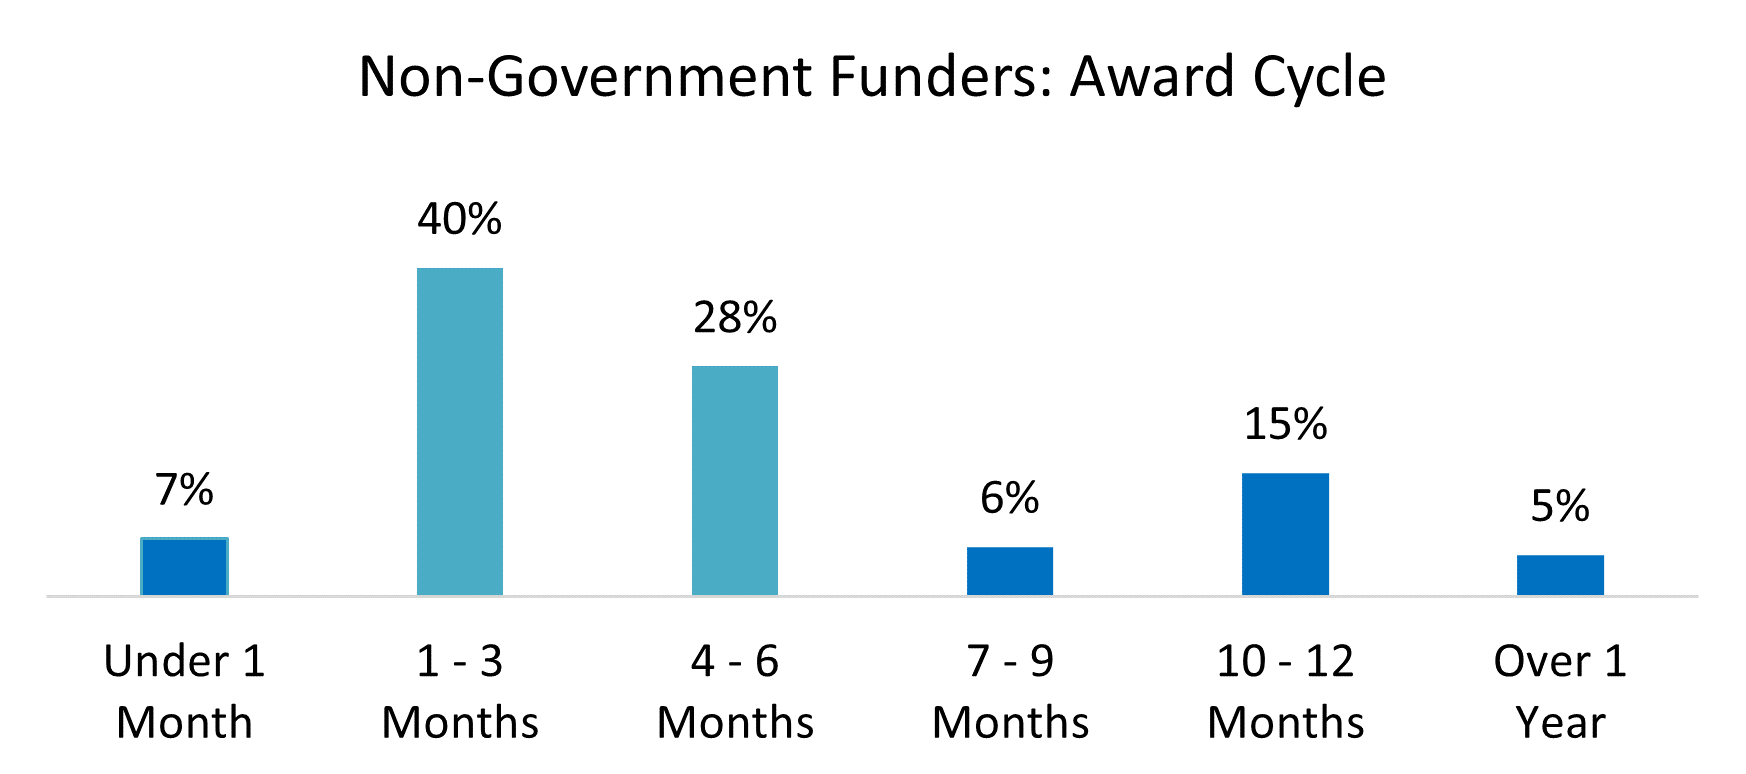
The government grant cycle length—from proposal submission to award decision—for the largest award was between one and six months for 52% of respondents, while 1% reported a short grant cycle of less than a month. A longer grant cycle of seven months or more was reported by 46% of respondents. The longer grant cycle reflects the government application process; the non-government application process took seven months or more for 26% of respondents.
Staff Involvement
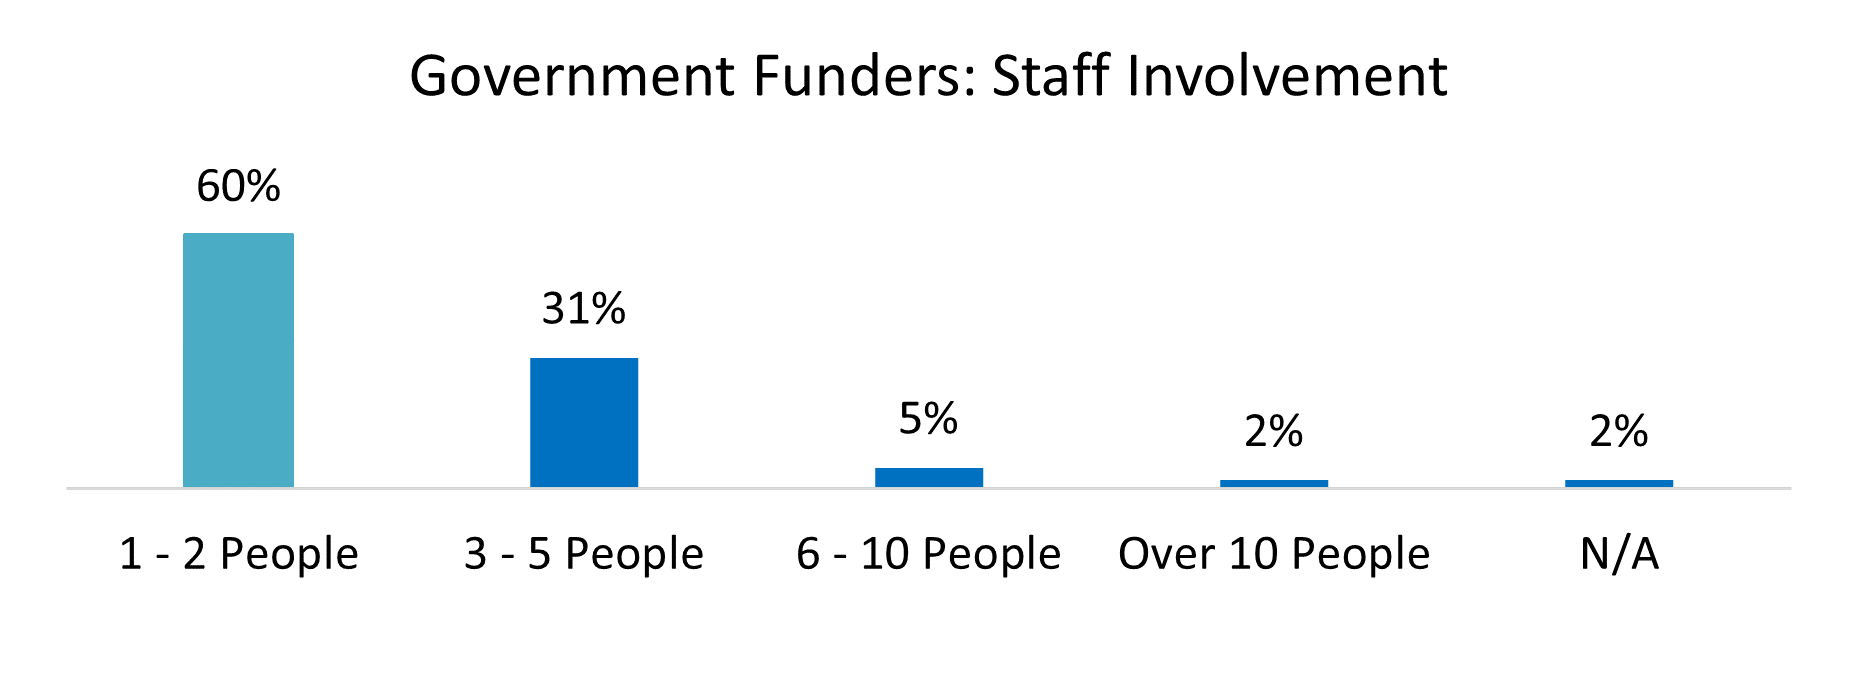
For 60% of respondents, one to two people were directly involved in the grantseeking process for the largest individual government award. Thirty-one percent of respondents reported that three to five people were directly involved, and 7% reported six or more people were directly involved. Two percent of respondents reported no direct staff involvement. This represents more staff involvement than for non-government awards, for which 76% of respondents reported one to two people were directly involved in the grantseeking process.
Award Cycle
Once an award decision had been determined, funders released the award monies quickly; 56% of respondents reported receiving the award within three months of notification. Delayed receipt of award monies, taking four months or more, was reported by 44% of respondents. The longer award cycle reflects government processes; non-government release of award monies took four months or more for 18% of respondents.
Time Allocation
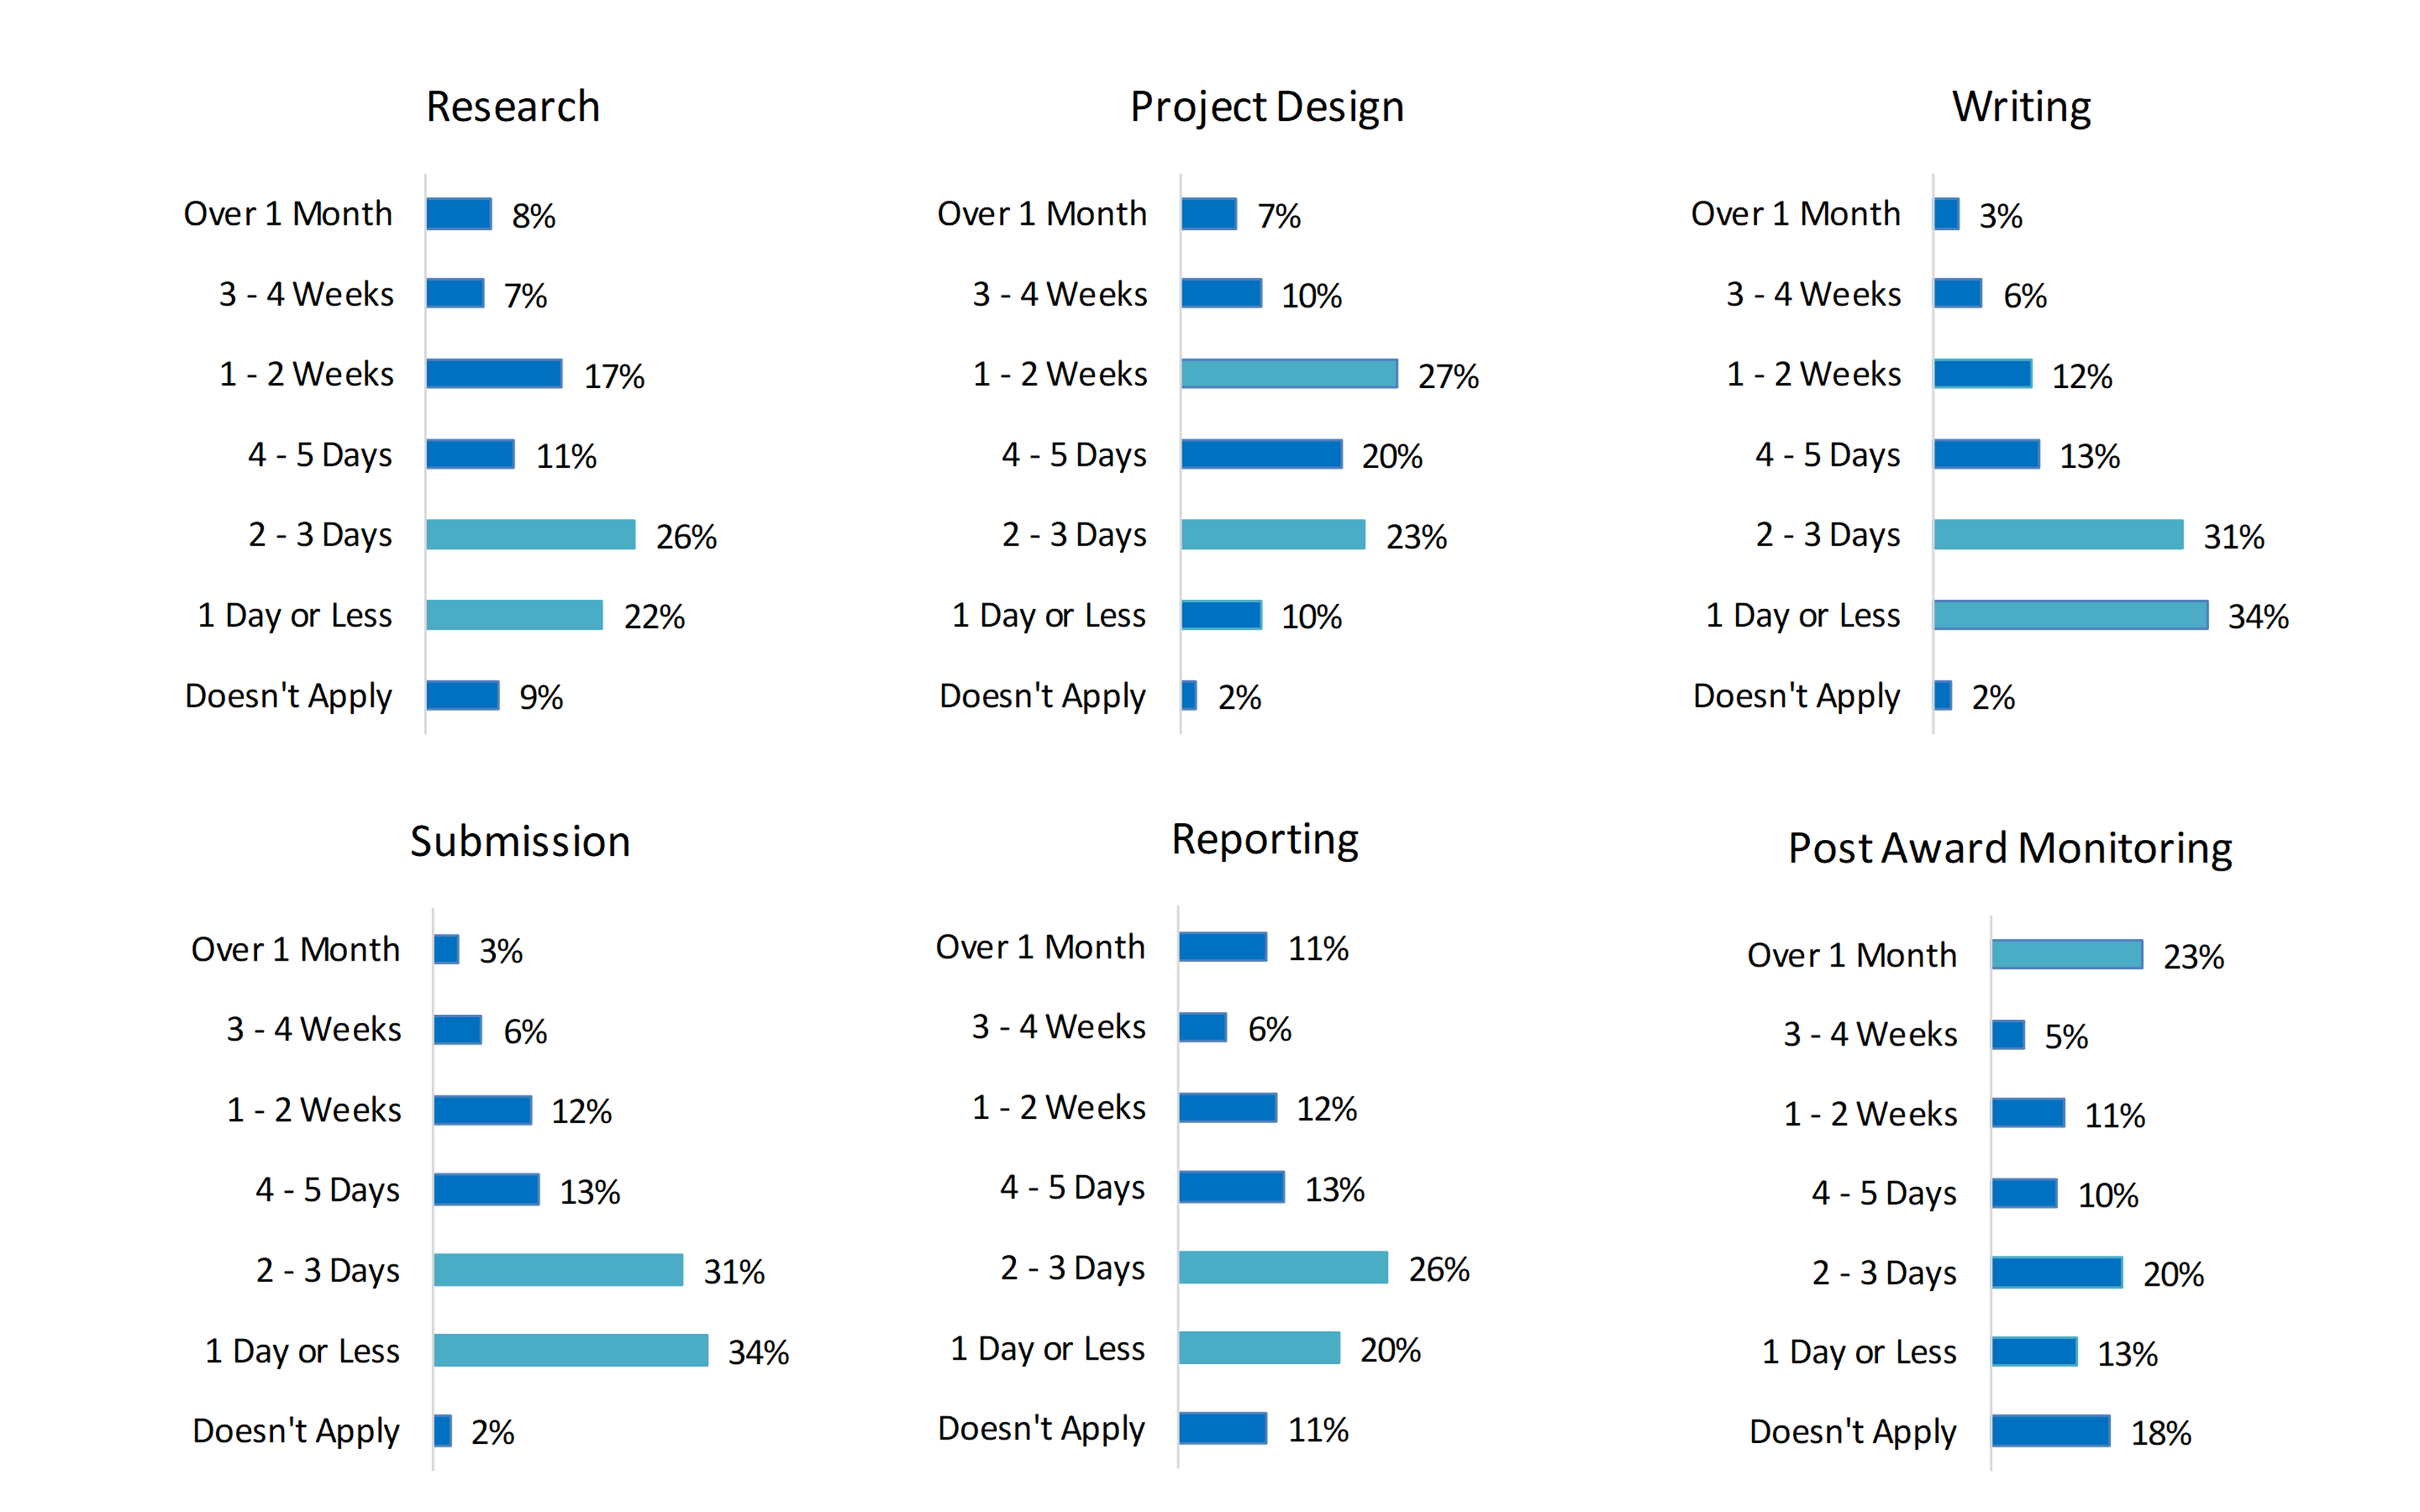
For the largest individual award from a government funder, we asked respondents to tell us how much time was spent on research to support the statement of need, project design, writing the proposal, coordination of the attachments and submission, reporting, and post-award monitoring. For most respondents, the various facets of the government grant process took three or fewer days. However, project design and strategy took four days or longer for 64% of respondents, and post-award monitoring took four days or longer for 49% of respondents.
Government Largest Award Size
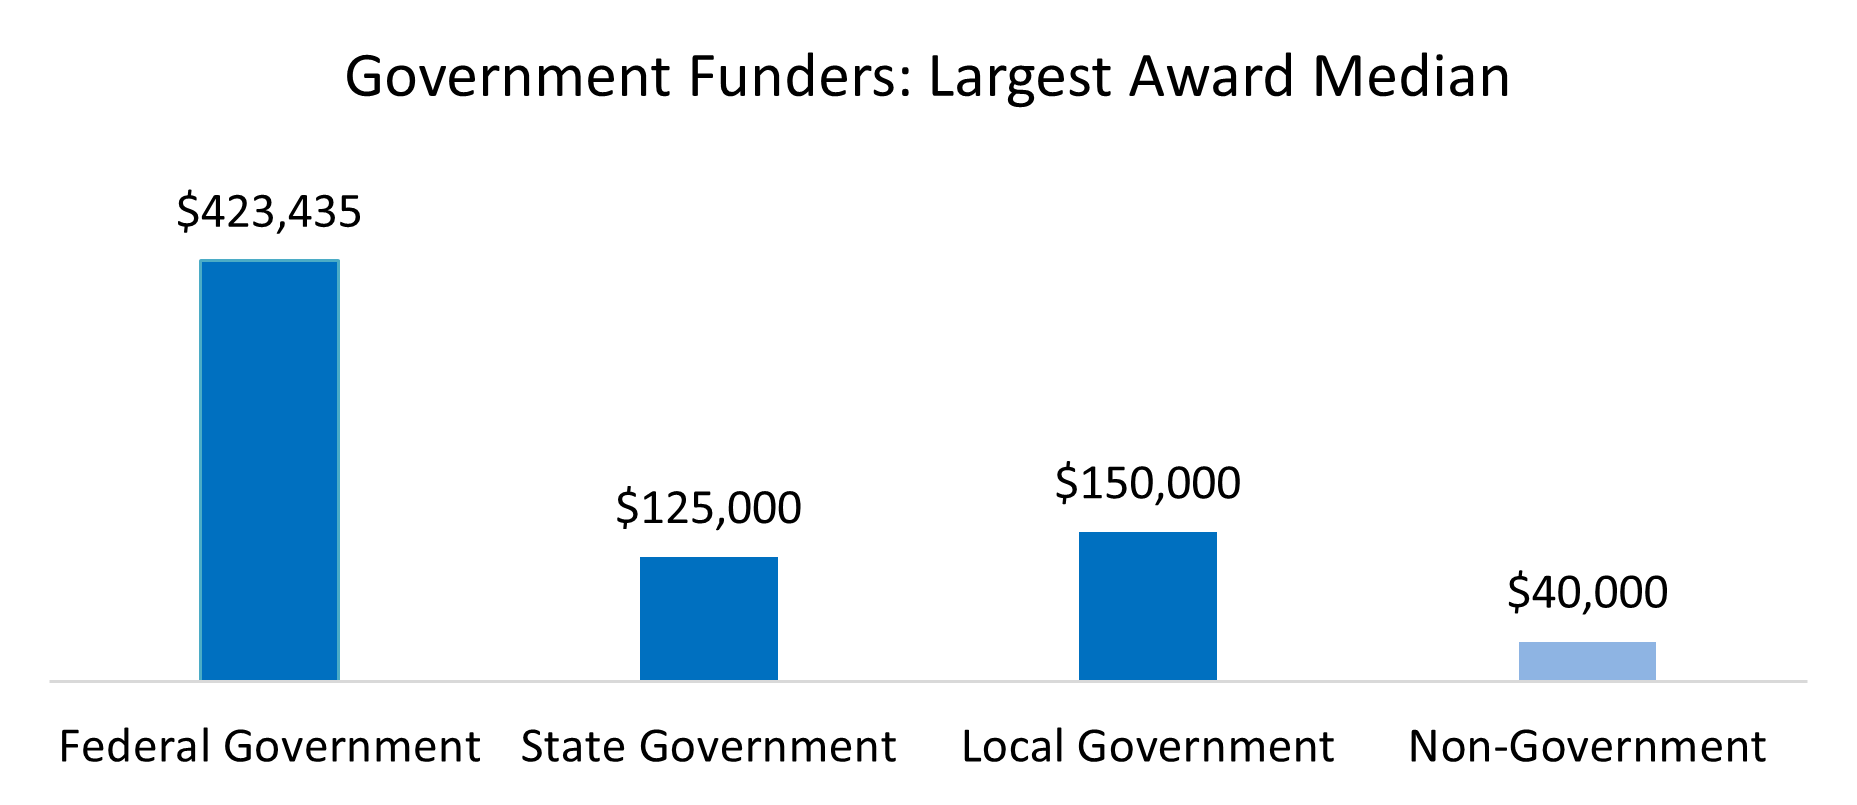
The largest individual award medians from government entities were higher than those from non-government funders. The largest individual award median was $423,435 for the Federal government, $125,000 for state government, and $150,00 for local government. In comparison, the largest award median from non-government funders (private foundations, community foundations, corporate grantmakers, donor-advised funds, and “other” sources, in aggregate) was $40,000.
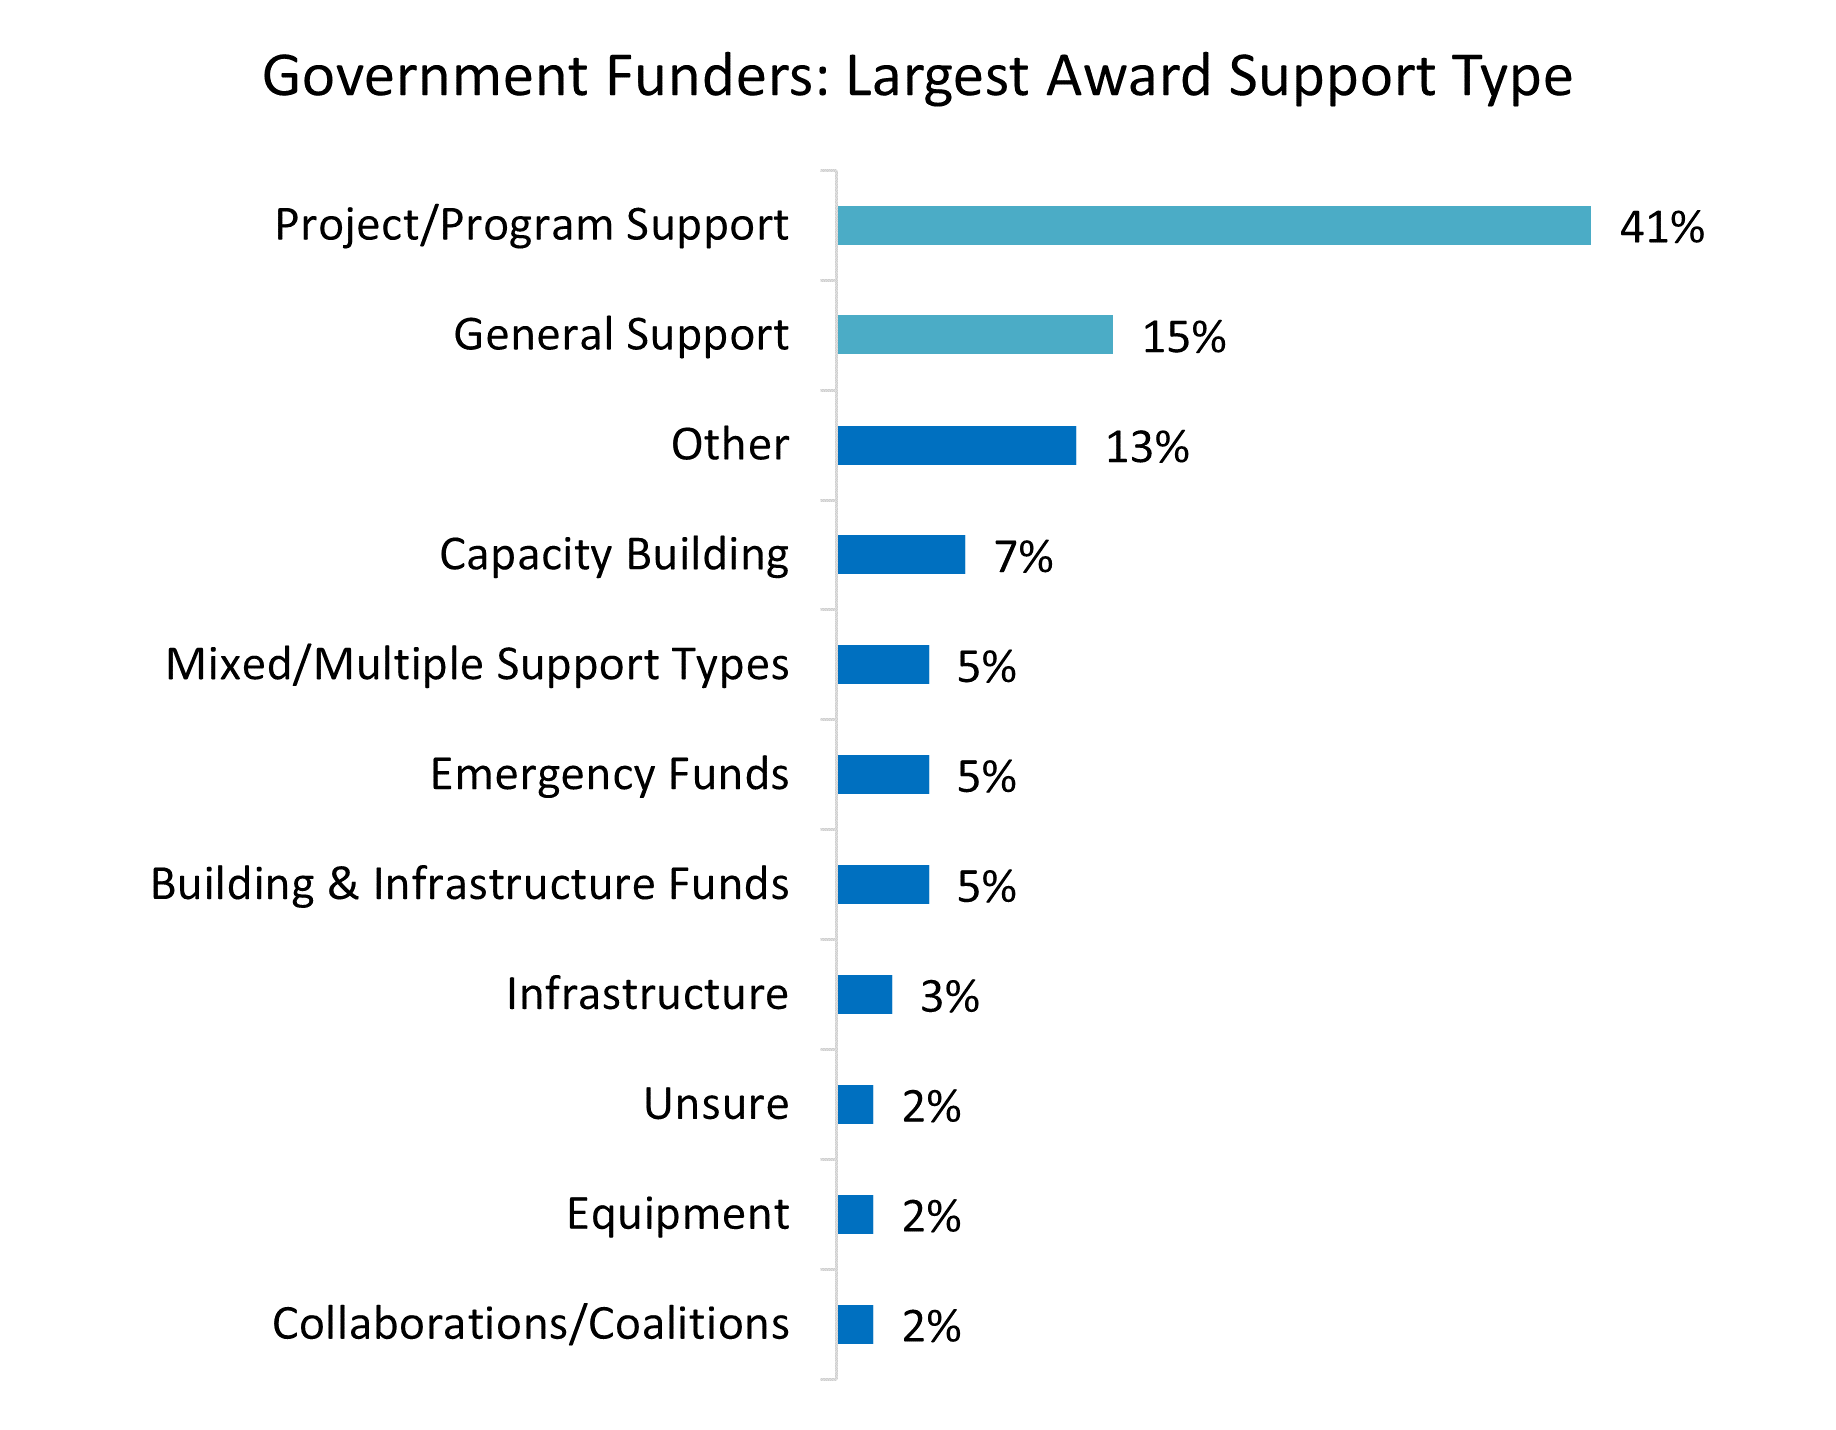
Government Largest Award Support Type
The largest government award received by 41% of respondents was in the form of project or program support, whereas the largest government award received by 15% of respondents was in the form of general support. The “other” category, comprised of support types reported at a rate of less than 2% (including advocacy, collaborations, matching grants, and training programs) was reported by 13% of respondents. Capacity building was the largest support type for 7% of respondents, while mixed support types, emergency funds, and building and infrastructure awards were each reported as the largest form of support by 5% of respondents. The remaining support types were reported by 2% to 3% of respondents.
Federal government funding
Forty percent of respondents reported that their organizations regularly receive Federal funding, and 36% stated that their organizations received Federal funding in 2022.
Federal government award form
Those organizations that received Federal funding during 2022 reported that their largest Federal award came in the form of grants (65%), contracts (10%), or another form (16%), including COVID-19 relief funding administered by the Small Business Administration, cooperative agreements, and reimbursements. Nine percent were unsure of the form of funding.
Federal government award origin
Forty-four percent of the funds for the largest Federal award originated directly from the Federal government, while 25% originated as pass-through Federal funding via a state government. Twenty-seven percent originated in another form, primarily as pass-through funding from non-Federal levels of government, tribal agencies, or nonprofit organizations. Five percent of respondents were unsure of where their Federal funding originated.
Federal government matching funds
Forty-three percent of respondents that received Federal funding reported that their largest Federal award did not require matching funds, whereas 26% reported that matching funds were a requirement of their largest Federal award. Thirty-one percent of respondents that received Federal funding were unsure if matching funds were included as a requirement.
Of those organizations that received awards requiring matching funds, respondents most frequently reported a match of 10% or less (14%), of 11% to 25% (19%), or of 26% to 50% (11%). Ten percent of respondents reported a match of over 50%, and 47% of respondents were unsure of the match requirement.
Federal government indirect/administrative cost funding
The largest Federal award included indirect/administrative cost funding for 50% of respondents, while 33% reported that cost funding was not included, and 17% were unsure if this type of funding was included. A Federal direct cost agreement was included in the award for 21% of respondents. There was no direct cost agreement for 41% of respondents and 38% of respondents were unsure if a direct cost agreement was part of the Federal award.
Of those respondents that did receive indirect/administrative cost funding, 42% reported that their largest Federal award included an allocation of 10% or less for these costs, and 11% reported that the award included 11% to 20% funding for these costs. Ten percent of respondents reported that their largest Federal award included funding of 21% or more for indirect/administrative costs, while 37% were unsure of the level of funding allocated to these costs.
Respondents by Government Largest Award Source
As illustrated by The 2023 State of Grantseeking™ Survey results, a respondent organization’s demographics can be defined by the source of the largest award. The following are typical organizations that received their largest award from each funder type. You may choose to apply to funders that have provided awards to organizations that are demographically similar to your organization as part of your grantseeking strategy.
Organizations for which the Federal government was the largest award source
Eighty-one percent of survey respondents from organizations for which the Federal government was the largest award source (FGLAS) were directly associated with their organizations as employees (31%) or at an executive level (50%). Nonprofits comprised 80% of FGLAS organizations, while educational institutions comprised 7%. (Among respondents from educational institutions, 83% represented two- or four-year colleges and universities.) Eight percent of FGLAS organizations were government or tribal agencies, and 4% were libraries or businesses. FGLAS organizations frequently reported employing between one and five people (21%), over 200 people (17%), and between 11 and 25 people (15%). Sixty-four percent of FGLAS organizations reported annual budgets of $1,000,000 and over; of those, 16% reported annual budgets of $25,000,000 and over. The median annual budget was $2,007,425. FGLAS organizations were older than other organizations; 30% were 26 to 50 years old and 37% were over 50 years old. Forty-six percent of FGLAS organizations worked in a mix of service areas (rural, suburban, and urban) and 27% served urban areas. The most frequent geographic service reach for FGLAS organizations was multi-county (30%), one county (15%), or one state (14%). Human Services (29%), Education (13%), Art, Culture, and Humanities (13%), and Health (11%) were the most frequently reported mission focuses. Fifty-six percent of these organizations reported a service population comprised of over 50% individuals/families at or below the poverty level.
Organizations for which state government was the largest award source
Seventy-eight percent of survey respondents from organizations for which state government was the largest award source (SGLAS) were directly associated with their organizations as employees (28%) or at an executive level (50%). Nonprofits comprised 87% of SGLAS organizations, while educational institutions comprised 4%. (Among respondents from educational institutions, 67% represented two- or four-year colleges and universities.) Four percent of SGLAS organizations were government or tribal agencies, and 5% were libraries or businesses. SGLAS organizations most frequently reported employing one to five people (33%) or six to 25 people (25%). Annual budgets between $100,000 and $249,999 and $250,000 and $999,999 were each reported by 14% of SGLAS respondents, and 23% reported annual budgets between $1,000,000 and $4,999,999. Twenty-five percent of SGLAS organizations reported annual budgets of $5,000,000 or more. The median annual budget was $745,000. Most SGLAS organizations were 11 to 25 years old (19%), 26 to 50 years old (36%), or 51 to 100 years old (18%). Forty-four percent of SGLAS organizations worked in a mix of service areas (rural, suburban, and urban), while 24% served urban areas and 24% served suburban locations. The most frequent geographic service reach for SGLAS organizations was multi-county (28%), one county (21%), or one state (12%). Human Services (23%), Art, Culture, and Humanities (23%), and Education (9%) were the most frequently reported mission focuses. Forty-three percent of these organizations reported a service population comprised of over 50% individuals/families at or below the poverty level.
Organizations for which local government was the largest award source
Seventy-eight percent of survey respondents from organizations for which local government was the largest award source (LGLAS) were directly associated with their organizations as employees (25%) or at an executive level (53%). Nonprofits comprised 97% of LGLAS organizations. Most LGLAS organizations reported employing one to five people (32%) or six to 25 people (25%), while 13% reported employing between 26 and 75 people. LGLAS organizations most frequently reported annual budgets between $250,000 and $999,999 (24%) and between $1,000,000 and $4,999,999 (33%). The median annual budget was $1,100,000. Most LGLAS organizations were 11 to 25 years old (19%), 26 to 50 years old (29%), or 51 to 100 years old (23%). Forty-one percent served urban areas, while 34% worked in a mix of service areas (rural, suburban, and urban), and 18% served suburban locations. The most frequent geographic service reach for LGLAS organizations was multi-county (29%), one county (19%), or one state (13%). Human Services (29%), Art, Culture, and Humanities (20%), and Health (8%) were the most frequently reported mission focuses. Fifty percent of these organizations reported a service population comprised of over 50% individuals/families at or below the poverty level.
Non-Government Funding
Non-Government Funding Sources
Among those respondents that reported non-government funding sources, private foundations (88%) were most frequently reported as a non-government funding source, followed by community foundations (75%), corporate grantmakers (62%), and donor-advised funds (40%). Respondents also reported the receipt of corporate gifts (29%) and funding from “other” sources (5%).
Non-Government LARGEST SOURCE OF TOTAL FUNDING
Among respondents that reported non-government funding sources, private foundations (58%) were most frequently reported as the largest total source of this type of funding, followed by community foundations (22%), corporate grantmakers (13%), donor-advised funds (4%), and “other” grant sources (4%). Three percent of these respondents reported government funders as their largest source of total funding.
Non-Government LARGEST INDIVIDUAL AWARD SOURCE
Among those respondents that reported non-government funding sources, private foundations (61%) were most frequently reported as the largest individual award source, followed by community foundations (22%), corporate grantmakers (14%), and donor-advised funds (4%).
Non-Government Grant Cycle
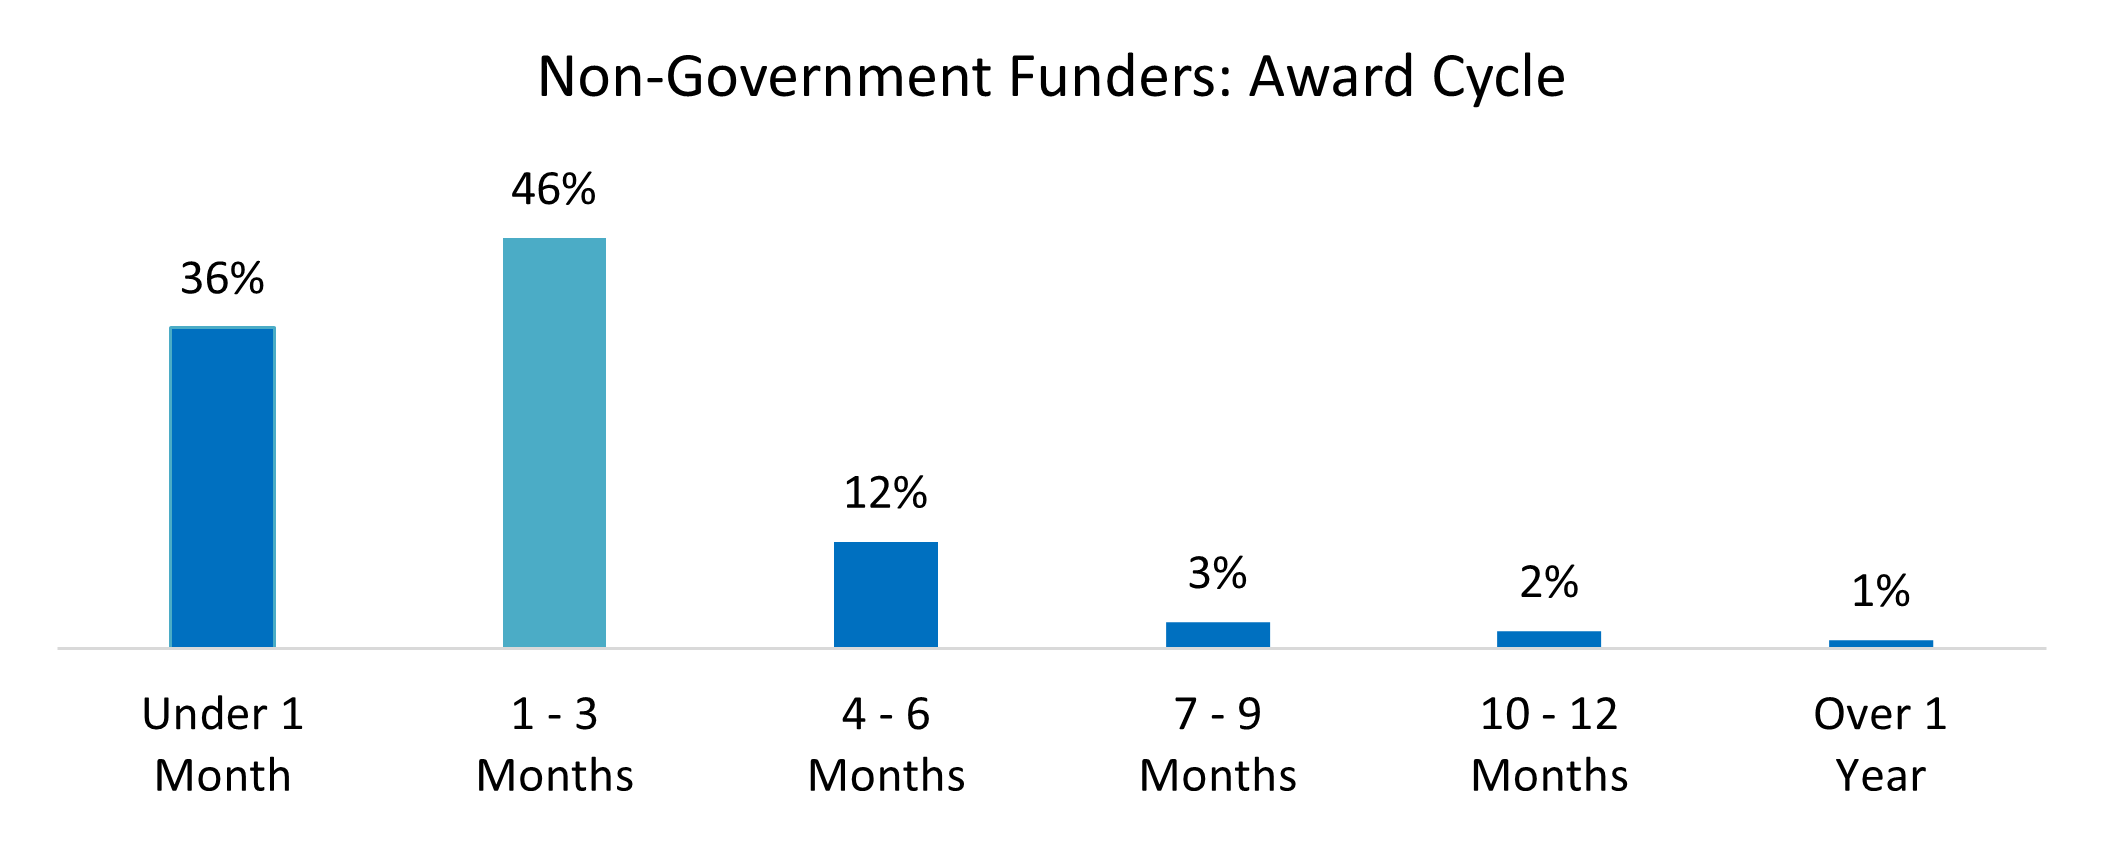
The non-government grant cycle length—from proposal submission to award decision—for the largest award was between one and six months for 68% of respondents, while 7% reported a short grant cycle of less than a month. A longer grant cycle of seven months or more was reported by 26% of respondents. The shorter grant cycle for non-government funders reflects an application process that is often simpler than that of government applications; the government application process took seven months or more for 46% of respondents.
Staff Involvement
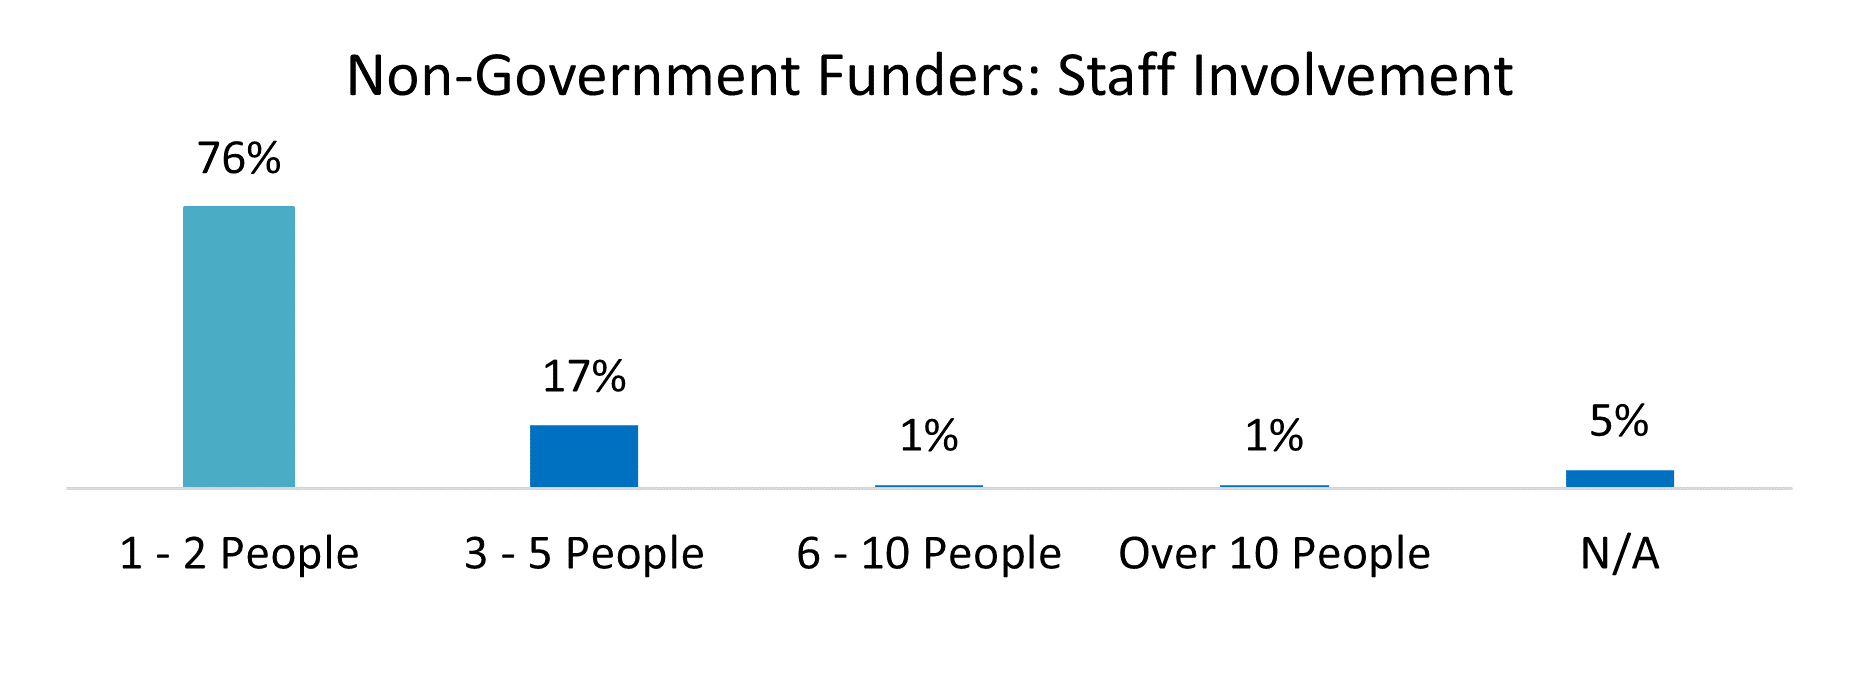
For 76% of respondents, one to two people were directly involved in the grantseeking process for the largest individual non-government award. Seventeen percent of respondents reported that three to five people were directly involved, and 2% reported six or more people were directly involved. Five percent of respondents reported no direct staff involvement. This represents less staff involvement than for government awards, where 60% of respondents reported one to two people were directly involved in the grantseeking process.
Non-Government Award Cycle
Once an award decision had been determined, non-government funders generally released the award monies within three months of notification (82%). Delayed receipt of award monies, taking four months or more, was reported by 18% of respondents. This timing is significant, as delayed release of funds from government sources was reported by 44% of respondents.
Time Allocation
For the largest individual award from a non-government funder, we asked respondents to tell us how much time was spent on research to support the statement of need, project design, writing the proposal, coordination of the attachments and submission, reporting, and post-award monitoring. For most respondents, the various facets of the non-government grant process took three or fewer days. However, writing grant applications took from two days to two weeks for 72% of respondents.
Non-Government Largest Individual Award Size
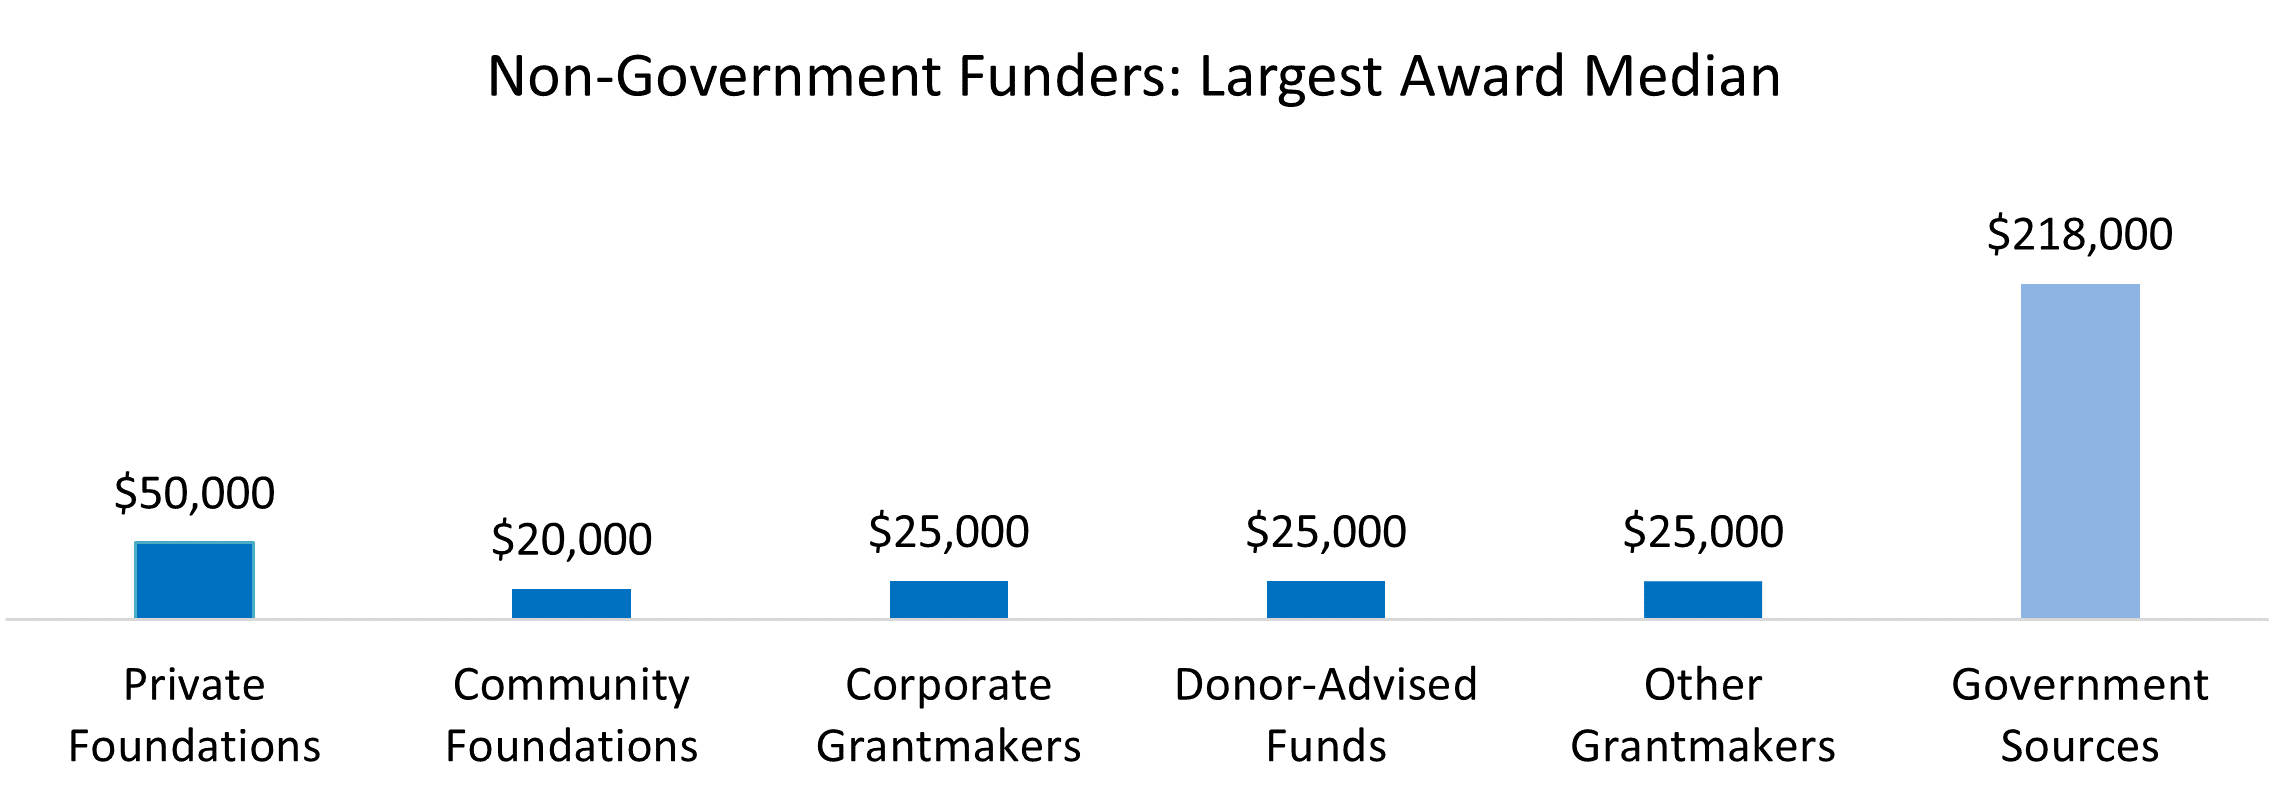
The largest individual award median from non-government entities was lower than that from government funders (an aggregate of Federal, state, and local government). The largest award median from private foundations was $50,000. The largest award median from corporate grantmakers, donor-advised funds, and “other” funding sources (including religious organizations, the United Way, civic organizations, other nonprofit organizations, and tribal funds) was $25,000 each, while that from community foundations was $20,000. In comparison, the largest individual award median from government funders was $218,000.
Non-Government Largest Award Support Type
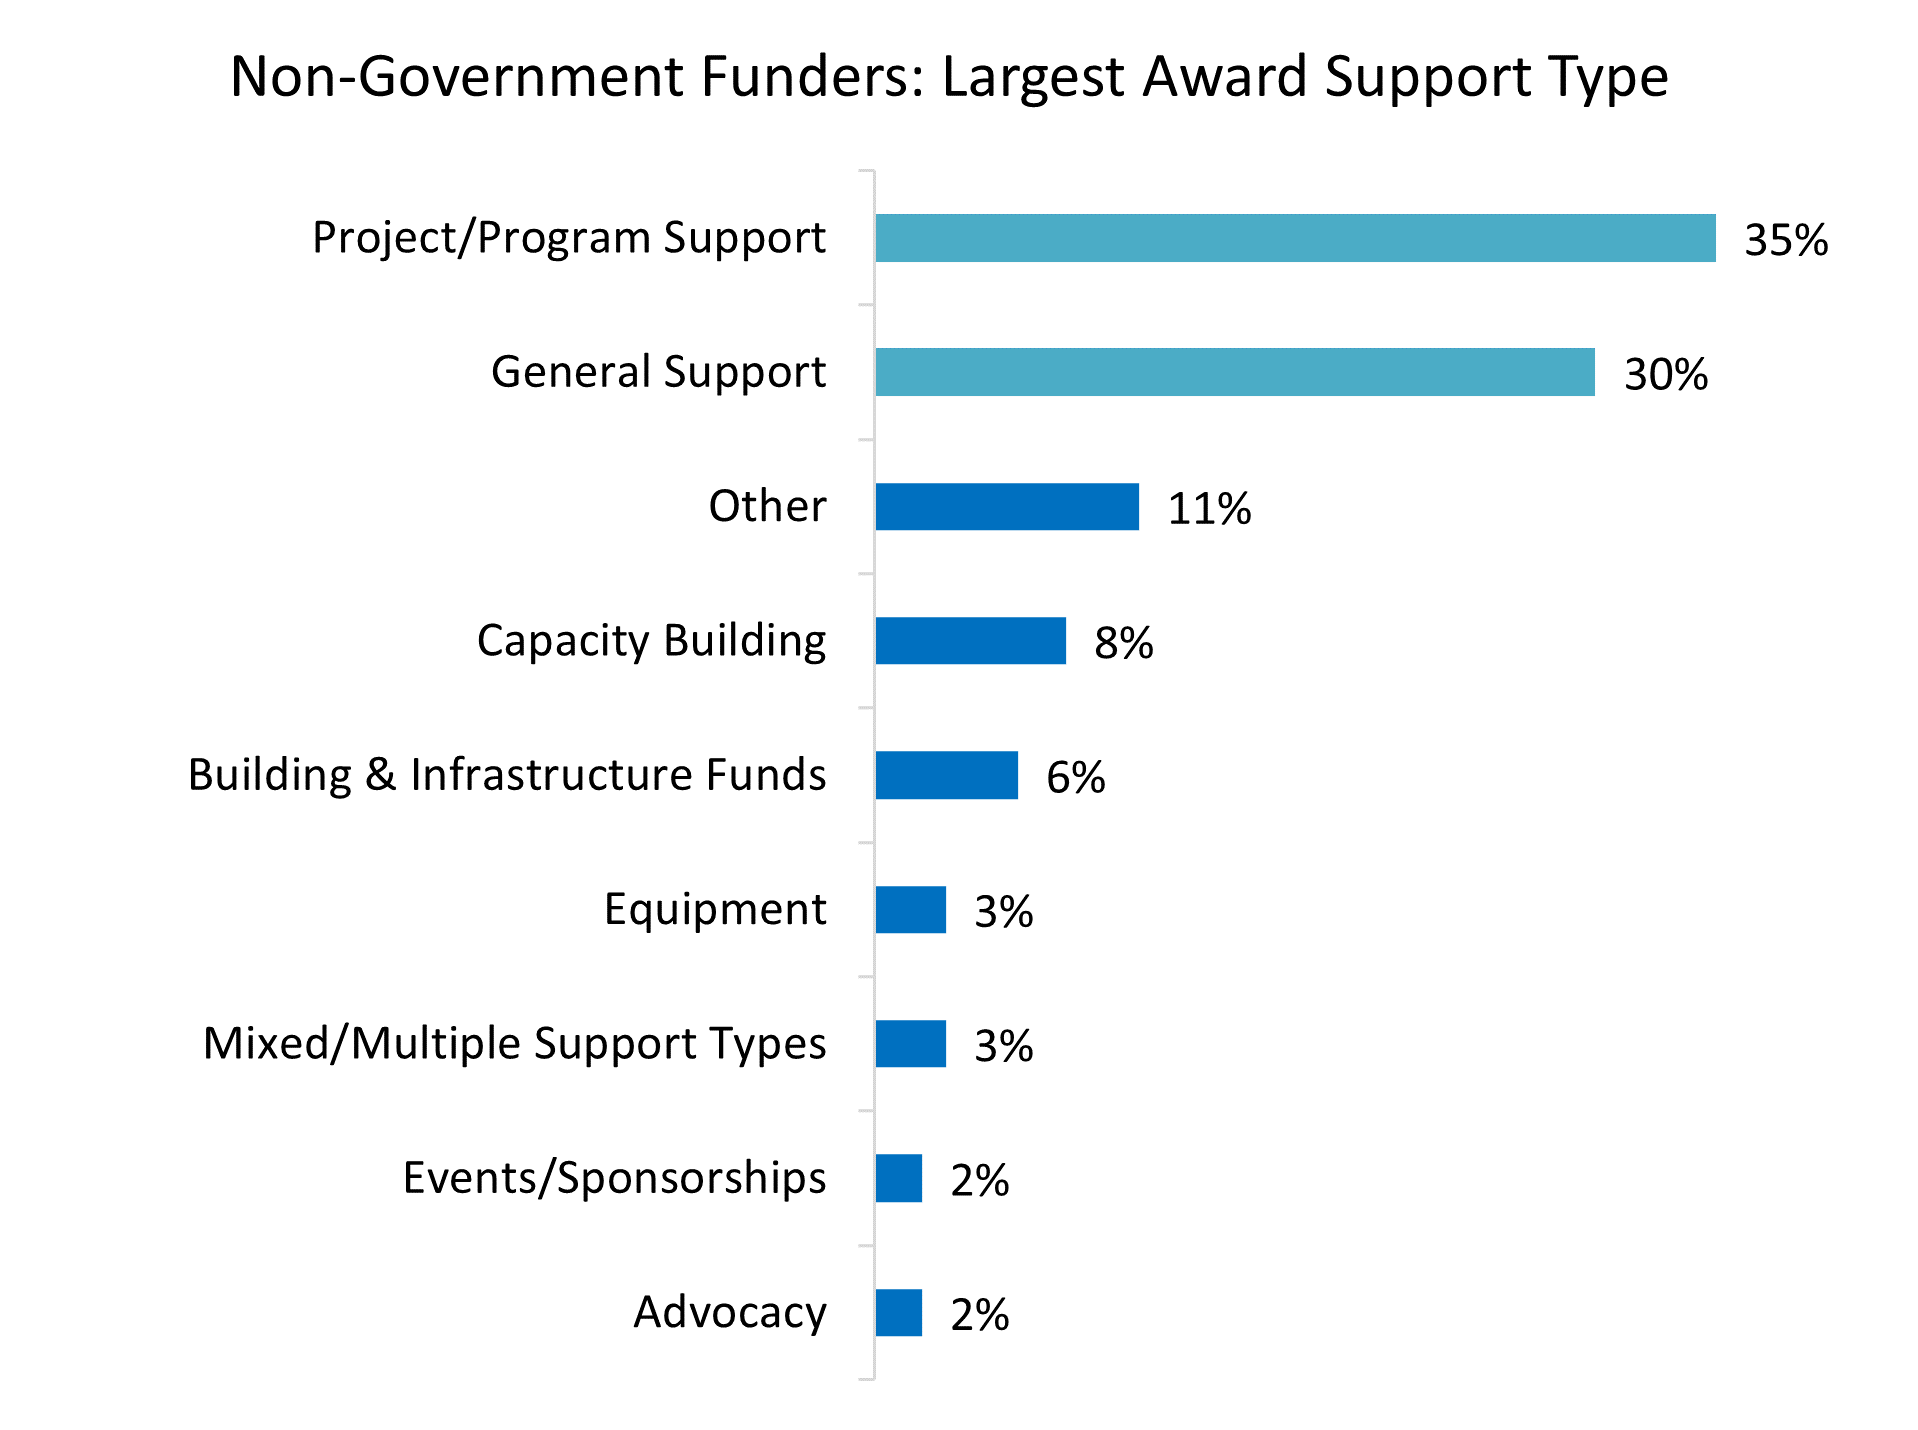
The largest non-government award received by 35% of respondents was in the form of project or program support, followed by general support at 30%. Respondents also reported the largest non-government award type as capacity building (8%) and building and infrastructure funds (6%). In addition, equipment (3%), mixed/multiple support types (3%), events/sponsorships (2%), and advocacy (2%) funding were reported as the form of support of the largest individual award. The “other” category, comprised of support types reported at a rate of less than 2% (including collaborations, matching, emergency, and training funds) was reported by 11% of respondents.
Respondents by Largest Award Source
As illustrated by The 2023 State of Grantseeking™ Survey results, a respondent organization’s demographics can be defined by the source of the largest award. The following are typical organizations that received their largest award from each funder type. You may choose to apply to funders that have provided awards to organizations that are demographically similar to your organization as part of your grantseeking strategy.
Organizations for which private foundations were the largest award source
Eighty-two percent of survey respondents from organizations for which private foundations were the largest award source (PFLAS) were directly associated with their organizations as employees (27%) or at an executive level (55%). Nonprofits comprised 94% of PFLAS organizations. PFLAS organizations most frequently reported employing one to five people (40%), six to ten people (13%), or 11 to 25 people (14%). Twenty percent of PFLAS organizations reported annual budgets between $250,000 and $499,999, while annual budgets between $500,000 and $999,999 were reported by 16% of respondents. Twenty-five percent of respondents reported annual budgets between $1,000,000 and $4,999,999. The median annual budget was $643,000. PFLAS organizations were 11 to 25 years old (25%) or 26 to 50 years old (30%). Forty percent worked in a mix of service areas (rural, suburban, and urban), while 29% were in urban areas and 21% worked in suburban areas. The most frequent geographic service reach for PFLAS organizations was multi-county (26%) or one county (15%). Human Services (22%), Art, Culture, and Humanities (15%), and Education (10%) were the most frequently reported mission focuses. Forty-eight percent of PFLAS organizations reported a service population comprised of over 50% individuals/families at or below the poverty level.
Organizations for which community foundations were the largest award source
Eighty percent of survey respondents from organizations for which community foundations were the largest award source (CFLAS) were directly associated with their organizations as employees (14%) or at an executive level (66%). Nonprofits comprised 94% of CFLAS organizations. CFLAS organizations most frequently reported employing one to five people (40%), employing six to 25 people (15%), employing less than a full-time equivalent person (10%), or being staffed by volunteers (23%). Twenty-nine percent of CFLAS organizations reported annual budgets under $100,000, while 27% reported budgets between $100,000 and $249,999 and 28% reported annual budgets between $250,000 and $999,999. Sixteen percent of CFLAS organizations reported annual budgets of $1,000,000 or more. The median annual budget was $244,425. Most CFLAS organizations were one to ten years old (28%), 11 to 25 years old (21%), or 26 to 50 years old (34%). Thirty-four percent worked in a mix of service areas (rural, suburban, and urban), while 23% were in an urban service area and 31% were in a suburban service area. The most frequent geographic service reach for CFLAS organizations was multi-county (33%), one county (21%), or multi-city/town (14%). Human Services (28%), Art, Culture, and Humanities (13%), Education (9%), Youth Development (9%), and Animal Related (8%) were the most frequently reported mission focuses. Fifty-two percent of these organizations reported a service population comprised of over 50% individuals/families at or below the poverty level.
Organizations for which corporations were the largest award source
Seventy-two percent of survey respondents from organizations for which corporations were the largest award source (CLAS) were directly associated with their organizations as employees (11%) or at an executive level (61%). Nonprofits comprised 97% of CLAS organizations. CLAS organizations most frequently reported employing one to five people (38%), employing six to 25 people (22%), employing less than a full-time equivalent person (10%), or being staffed by volunteers (18%). Twenty-three percent of CLAS organizations reported annual budgets between $100,000 and $250,000, while 15% reported annual budgets between $250,000 and $499,999, and 20% reported annual budgets between $1,000,000 and $4,999,999. Annual budgets less than $100,000 were reported by 26% of respondents. The median annual budget was $384,000. Most CLAS organizations were one to ten years old (31%), 11 to 25 years old (35%), or 26 to 50 years old (21%). Forty-nine percent worked in a mix of service areas (rural, suburban, and urban), while 28% were in urban areas and 19% were in suburban areas. The most frequent geographic service reach for CLAS organizations was multi-county (29%), national (14%), or one state (14%). Human Services (23%), Animal Related (11%), and Education (10%) were the most frequently reported mission focuses. Fifty-three percent of these organizations reported a service population comprised of over 50% individuals/families at or below the poverty level.
Organizations for which Donor-Advised Funds were the largesT AWARD SOURCE
Eighty-nine percent of survey respondents from organizations for which donor-advised funds were the largest award source (DLAS) were directly associated with their organizations at an executive level (78%), while 11% of respondents were board members. Nonprofits comprised 93% of DLAS organizations. DLAS organizations most frequently reported employing one to five people (48%) or being staffed by volunteers (22%). Thirty-two percent of DLAS organizations reported annual budgets between $100,000 and $250,000, while 24% reported annual budgets between $250,000 and $499,999, and 20% reported annual budgets between $500,000 and $999,999. The median annual budget was $280,000. Most DLAS organizations were one to ten years old (44%) or 11 to 25 years old (26%). Sixty-seven percent worked in a mix of service areas (rural, suburban, and urban), while 15% were in urban areas. The most frequent geographic service reach for DLAS organizations was national (26%), multi-county (19%), multi-city/town (19%), or one state (15%). Human Services (22%) and Art, Culture, and Humanities (11%) were the most frequently reported mission focuses. Forty-nine percent of these organizations reported a service population comprised of over 50% individuals/families at or below the poverty level.
Organizations for which “other” sources were the largest award source
Seventy-one percent of survey respondents from organizations for which “other” sources (including religious organizations, the United Way, civic organizations, other nonprofit organizations, and tribal funds) were the largest award source (OLAS) were directly associated with their organizations as employees (13%) or at an executive level (58%), while 13% of respondents were board members. Nonprofits comprised 92% of OLAS organizations. OLAS organizations most frequently reported employing one to five people (28%), employing less than one full-time equivalent (14%), or being staffed by volunteers (36%). Forty-five percent of OLAS organizations reported annual budgets under $100,000, and 19% reported annual budgets between $100,000 and $249,999. The median annual budget was $150,000. Most OLAS organizations were ten years or younger (35%), 11 to 25 years old (25%), or 26 to 50 years old (21%). Forty-five percent worked in a mix of service areas (rural, suburban, and urban). Twenty-three percent were in urban service areas, whereas 17% were in suburban areas, and 21% were in rural areas. The most frequent geographic service reach for OLAS organizations was multi-county (28%), one state (13%), or multi city/town (13%). Human Services (28%), Art, Culture, and Humanities (12%), and Education (11%) were the most frequently reported mission focuses. Fifty percent of these organizations reported a service population comprised of over 50% individuals/families at or below the poverty level.
Collaborative Grantseeking
Participation and Awards
Collaborative grantseeking—organizations joining together to submit grant applications for joint activities or programs—is a trending topic. Many funders feel collaboration among nonprofits increases the effectiveness of awards. Most respondents (71%) did not participate in collaborative grantseeking in 2022. Thirty-six percent of those respondents that did submit a collaborative grant application reported winning an award.
Collaboration by Annual Budget
Increases in annual budget size, with the implied increases in staff and infrastructure, influenced collaborative activities. Fifty-four percent of organizations with budgets of $25,000,000 or more participated in collaborative grantseeking in 2022, whereas only 11% of organizations with budgets under $100,000 participated in collaborative grantseeking during this period.
Indirect/Administrative Cost Funding
Indirect/Administrative Costs as a Percentage of Budget
Our respondents generally kept their costs low; 62% reported indirect/administrative costs as 20% or less of their total budgets.
Indirect/Administrative Cost Funding Sources
Individual donations (38%) were the most frequent source of indirect/administrative funding. Fees for services supported these costs for 17% of respondents while foundation grants were reported by 16% of respondents. The “other” sources category, which included fundraisers, tax revenue, major donors, and general funds, was reported by 15% of respondents; 14% reported indirect/administrative costs were supported by government grants and contracts.
Indirect/Administrative Cost Funding Limitations
Respondents reported that non-government funders will assist with indirect/administrative costs, although they limit the amount that they are willing to cover. Forty percent of respondents reported an allowance of 10% or less for these costs, and 20% reported an allowance of 11% to 25% for these costs. Eight percent of respondents reported that non-government funders would not cover indirect/administrative costs, while 28% were unsure of the coverage level. Only 4% of respondents reported that non-government funders allocated over 25% of the budget for these costs.
Indirect/Administrative Cost Controls
Respondents were asked, “How did you reduce your indirect/administrative costs?” and were able to report multiple techniques. Reductions in the number of staff (37%), “other” reduction techniques (28%), reductions through increased reliance on volunteer labor (25%), and reductions in services and programs (20%) were the most frequently reported indirect/administrative cost control techniques. Managing costs by making reductions in the organization’s staff hours (11%) or staff salaries (11%), and by sharing a space or location (10%) were also frequently reported. Among the “other” reported reduction techniques, each of which were reported by fewer than 3% of respondents, cost savings through hiring freezes, virtual work, and non-replacement of technology were frequently cited.
Indirect/Administrative Cost Trends
Compared to indirect/administrative costs for the prior year, 42% of respondents reported that these costs had remained the same, while 50% reported that these costs had increased. Indirect/administrative costs decreased for 8% of respondents.
Challenges to Grantseeking
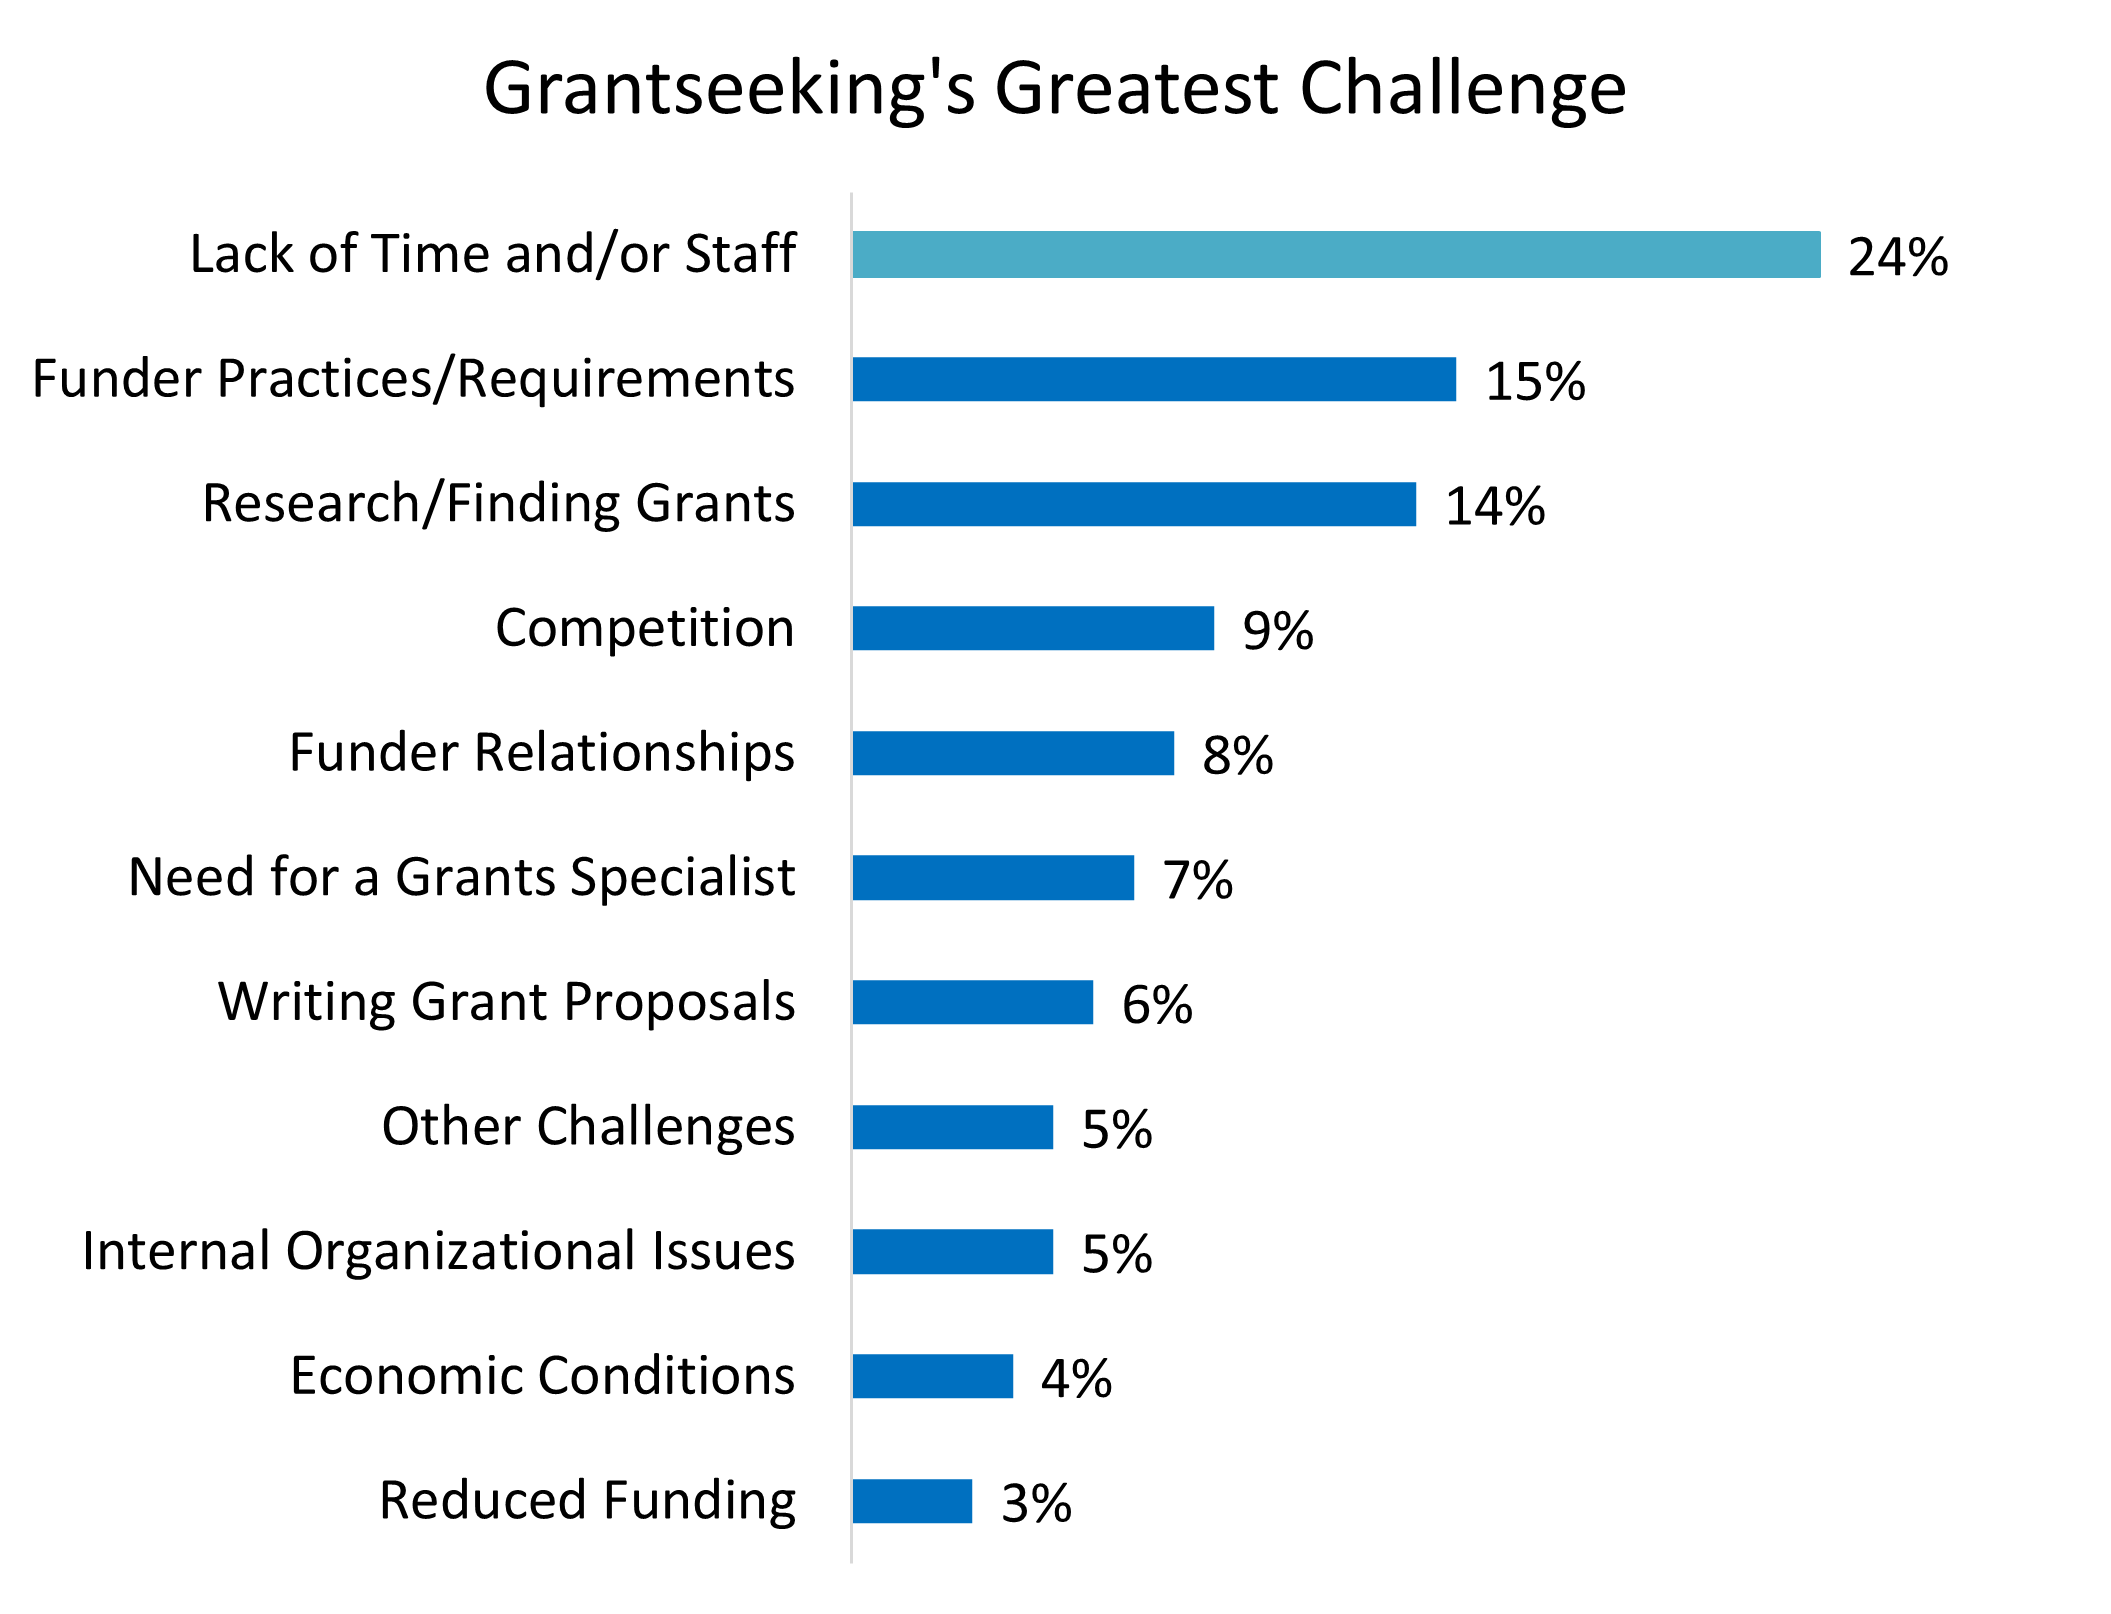
We asked, “What, in your opinion, is the greatest challenge to successful grantseeking?” Respondents continued to report that grantseeking’s greatest challenges stem from the lack of time and staff for grantseeking activities (24%).
Adherence to varying funder practices and requirements (15%) and difficulty in finding grant opportunities that matched with specific missions, locations, or programs (14%) were also frequently cited as the greatest challenge to successful grantseeking.
Respondents also reported increased competition for finite monies (9%), building funder relationships (8%), the need for a grants specialist (7%), and writing grant proposals (6%) as challenges to grantseeking success.
Internal organizational issues (5%), economic conditions (4%), and reduced funding (3%) were also reported as the greatest challenge to successful grantseeking.
“Other” challenges, reported by 5% of respondents, included changing funder priorities, reduced budgets, small organizational size, managing a grants program, and specific or rare mission focus were frequently reported as the greatest challenge to successful grantseeking.
Organization Annual Budget
Organizational size determined by annual budget appears to be a key factor influencing the grantseeking experience. The variations in funding by budget size emphasize the importance of comparing your organization to those with similar annual budget ranges. For this report, organizational budget ranges are defined as:
Total Funding
Larger organizations consistently reported higher total awards. The median value of total awards was $150,000. However, there were substantial differences by budget range. Median total awards ranged from $14,500 for small organizations to over $2.8 million for extra-large organizations.
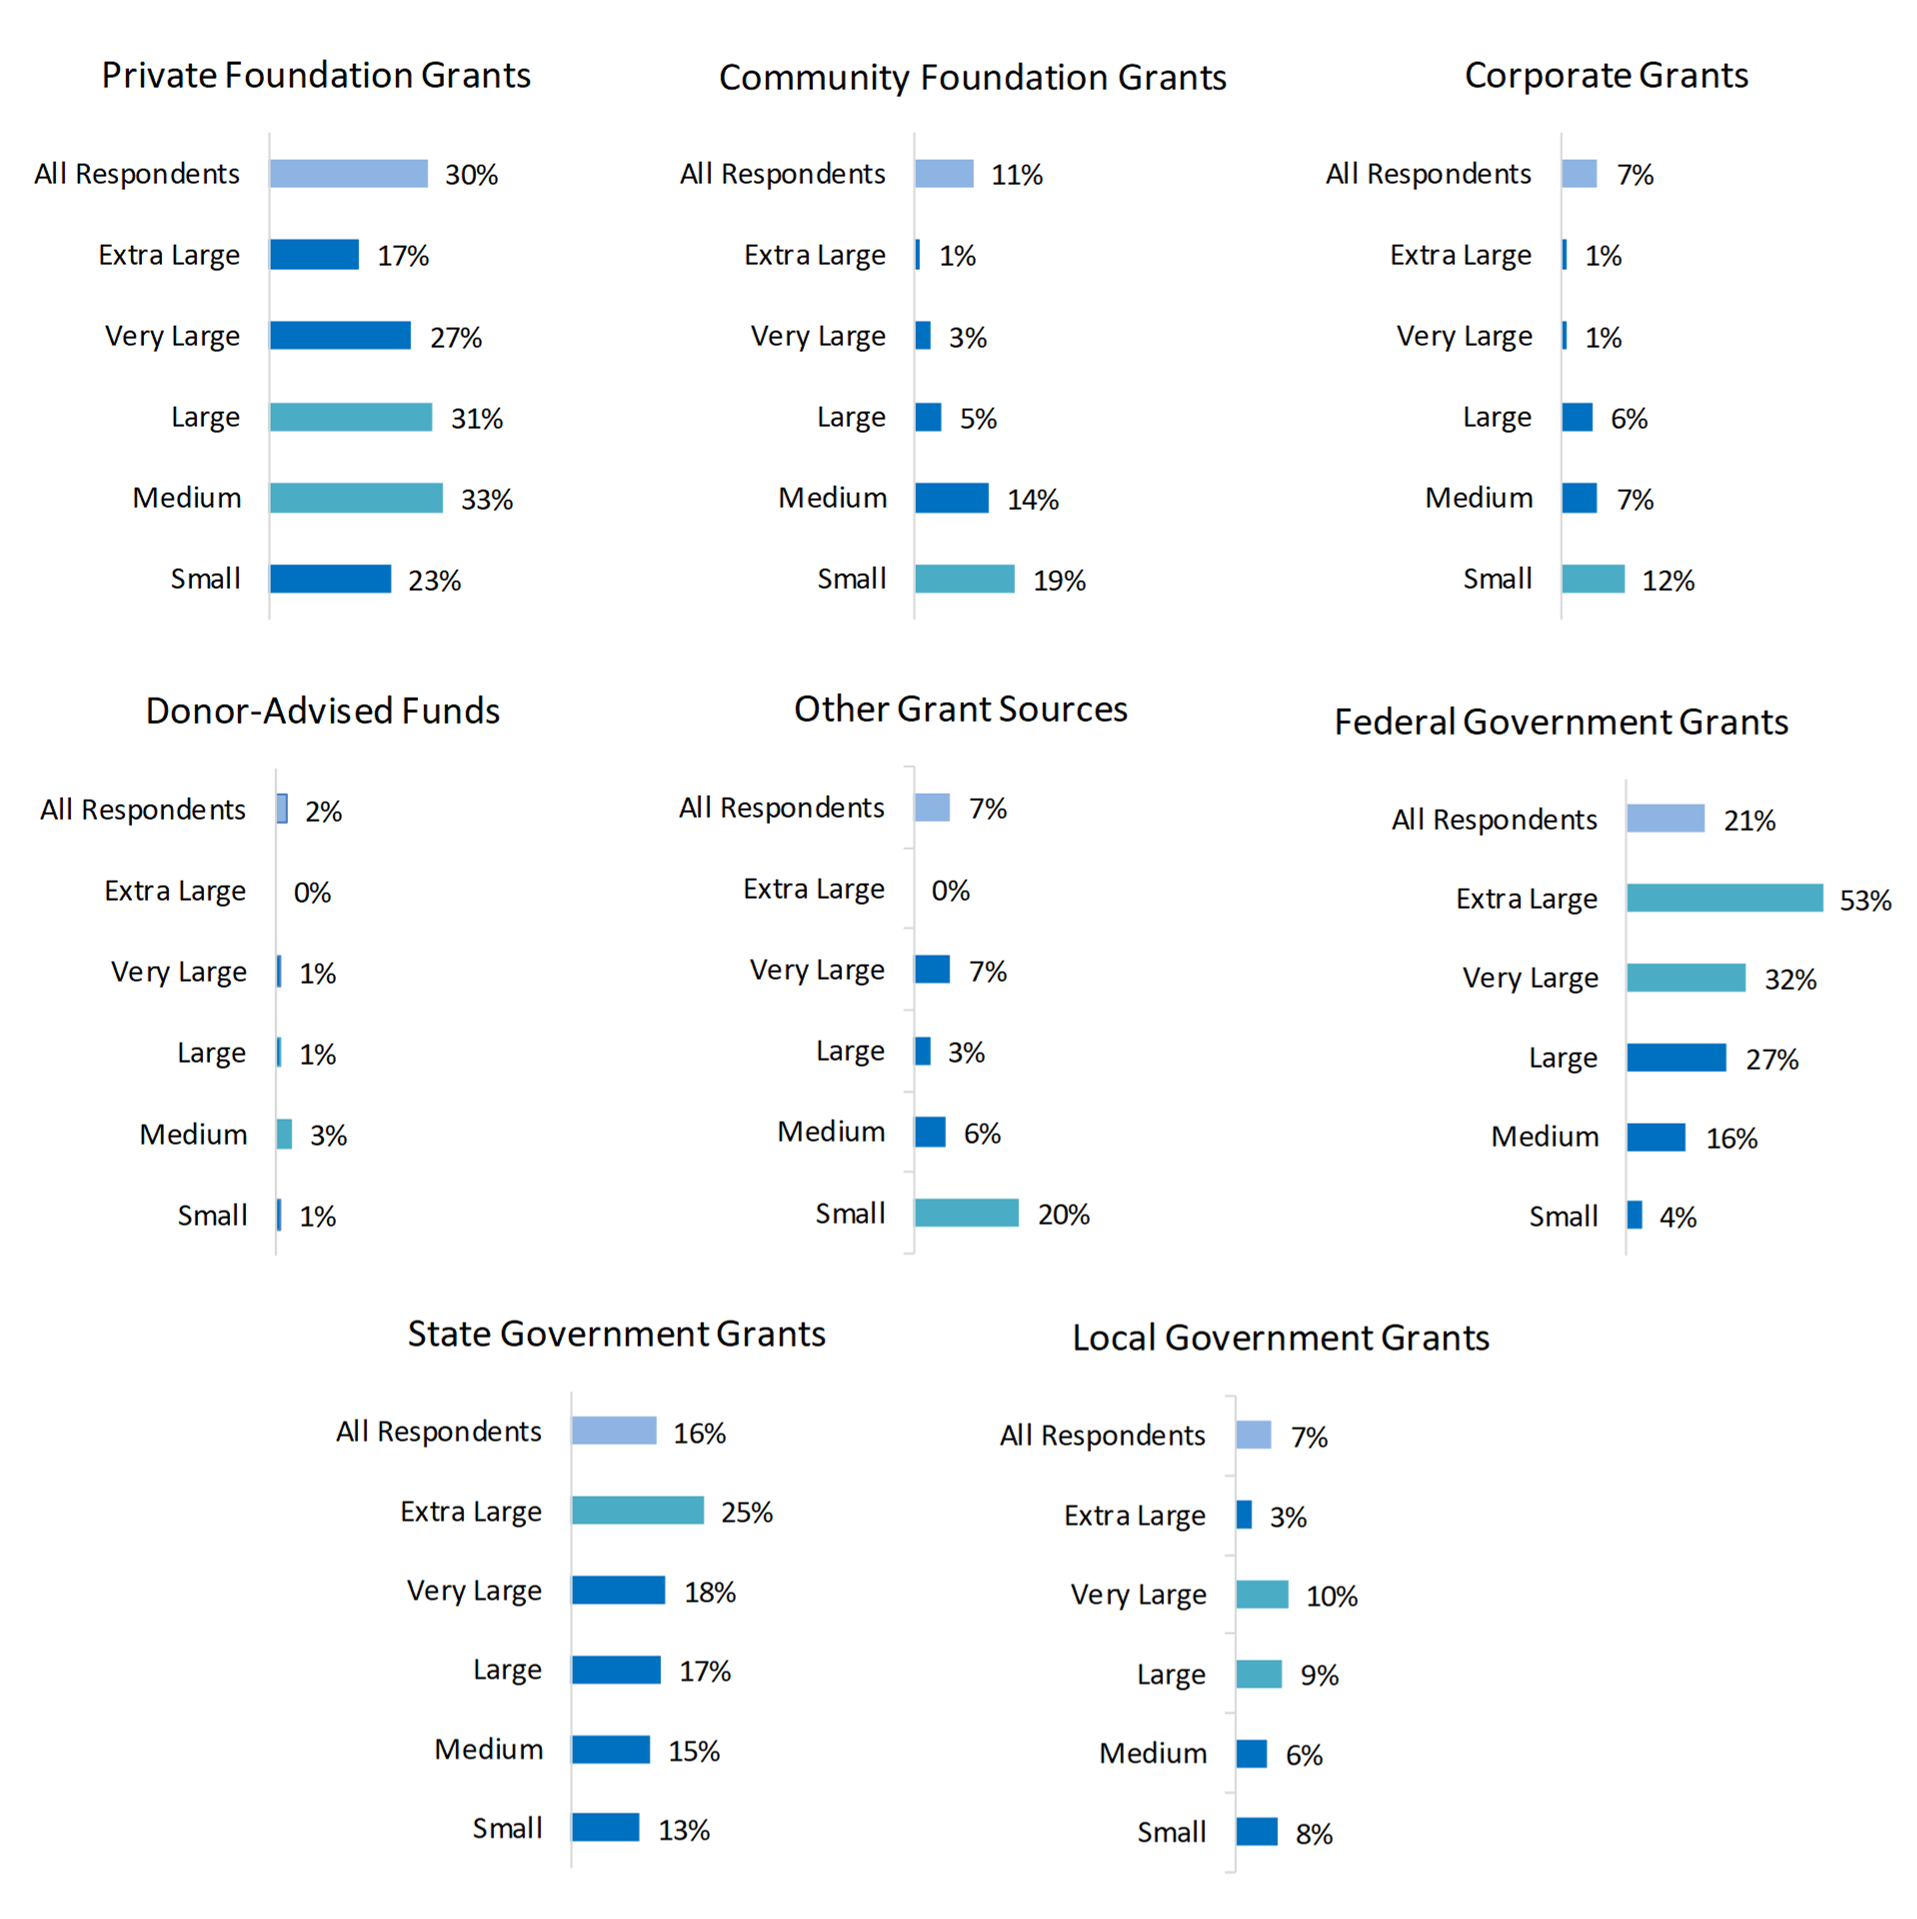
Largest Source Of Total Funding
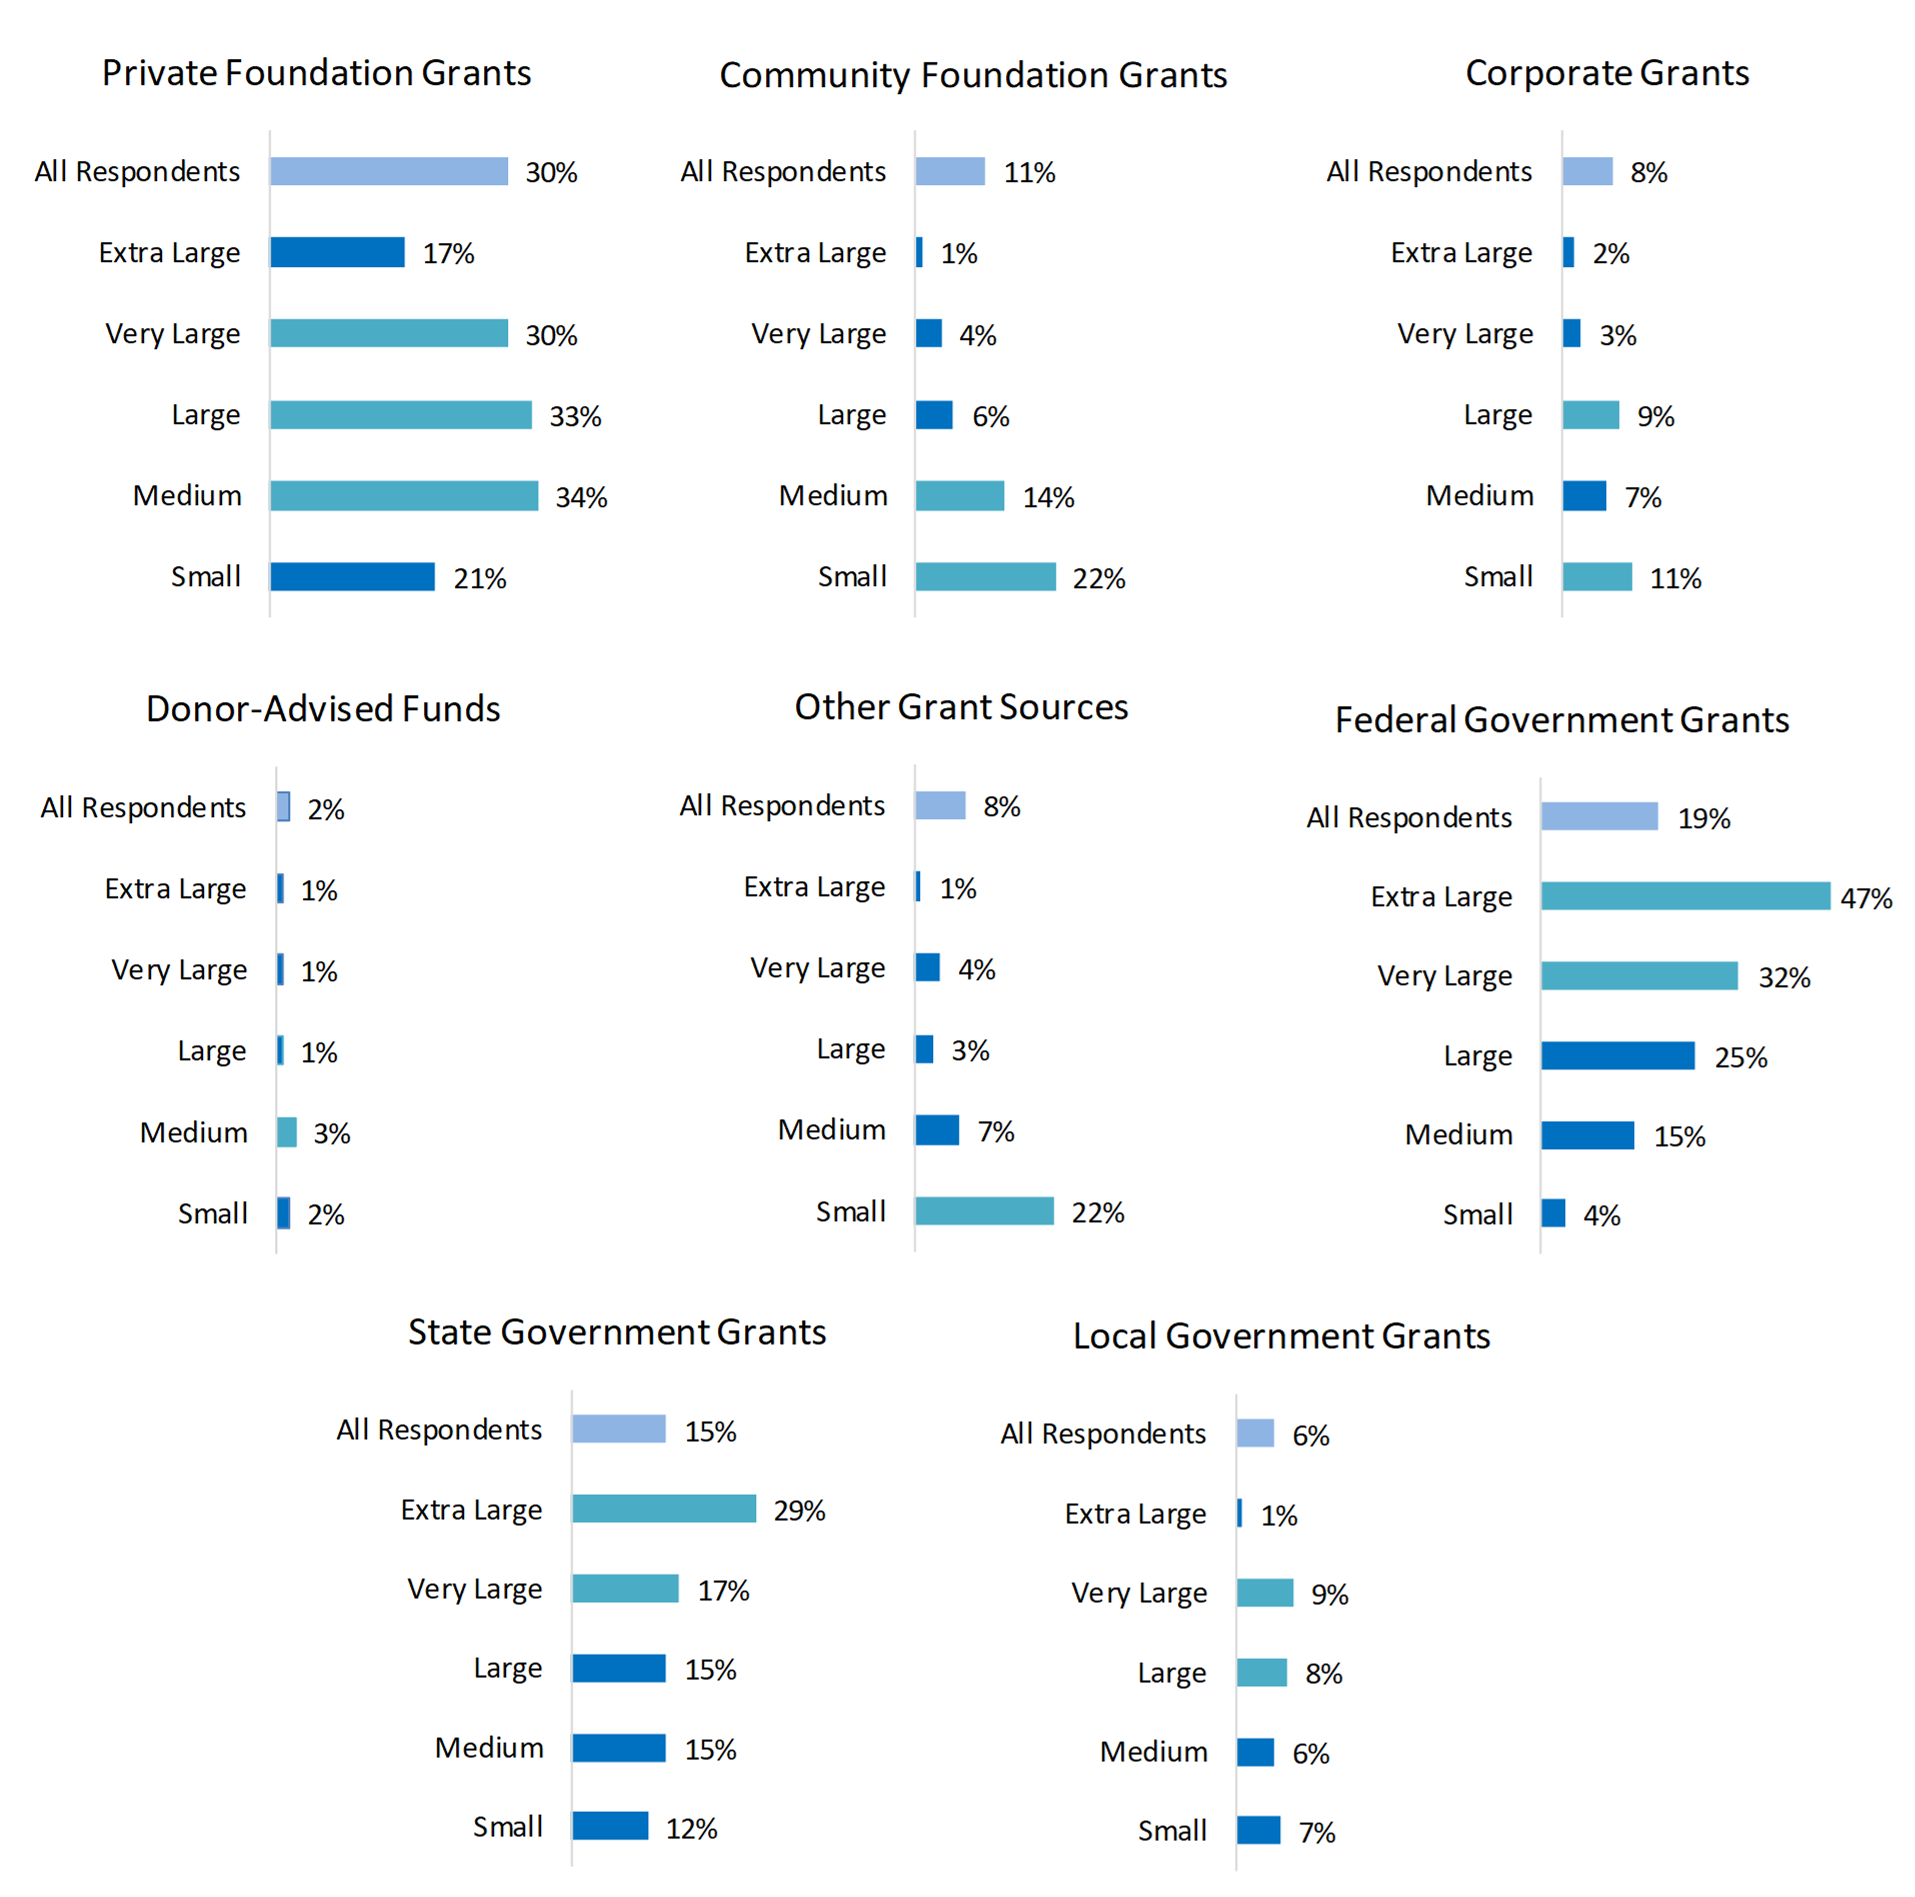
The largest source of total funding varied by organizational size. Federal and state government funding frequency increased with organizational budget size, whereas funding from community foundations and “other” funding sources (including religious organizations, the United Way, civic organizations, other nonprofit organizations, and tribal funds) generally decreased in relation to budget size. Private foundations were a frequent funder of organizations of any budget size, while donor-advised funds were infrequently cited as the largest source of total funding. Corporate grants and local government were infrequently cited as the largest source of total funding for extra-large organizations. The response rate for each source of funding, by organizational budget size, is listed in the following chart.
Largest Individual Award
Just as with total award sizes, larger organizations consistently reported larger individual award sizes. The median largest individual award was $74,500 for all survey respondents. When broken out by budget size, the median largest individual award ranged from $8,850 for small organizations to $1,763,800 for extra-large organizations.
Largest Individual Award Source
Organizations reported variations in the largest individual award source based on organizational budget size.
Extra-large organizations reported a much greater frequency of Federal government grants. Organizations should note that the median largest award size is substantially higher for government sources and consider these trends when setting realistic grantseeking expectations based on organizational size. For example, the median largest award for Federal grants was $423,435, while the median largest award from community foundations was $20,000.
Medium and large organizations most frequently reported private foundation grants as the largest award source. The median largest award for private foundation grants was $50,000.
The response rate for each source of funding, by organizational budget size, is listed in the following chart.
Respondents by Annual Budget Size
As illustrated by The 2023 State of Grantseeking™ Survey results, a respondent organization’s demographics and grantseeking experience can be further defined by their annual budget size. Annual budget impacts grantseeking because it speaks to organizational age and experience and to the size of staff and programs. The following are typical organizations that received their largest award from each funder type. You may choose to apply to funders that have provided awards to organizations that are demographically similar to your organization as part of your grantseeking strategy.
Organizations with Small Annual Budgets Under $100,000
Sixty-four percent of survey respondents from organizations with small budgets under $100,000 were directly associated with their organizations as employees (4%) or at an executive level (60%); 23% were board members. Nonprofits comprised 94% of small organizations. Small organizations most frequently reported all-volunteer staffing (51%), employing less than a full-time equivalent (22%), or employing one to five people (23%). The median annual budget was $42,000. Seventy-five percent of small organizations were 25 years old or younger. Small organizations were frequently one to five years old (31%), six to ten years old (16%), or 11 to 25 years old (26%). Forty percent worked in a mix of service areas (rural, suburban, and urban), while 22% were in urban areas and 21% were in suburban areas. The most frequent geographic service reach for small organizations was multi-county (20%), multi-city/town (14%), or international (13%). Art, Culture, and Humanities (19%), Human Services (17%), and Education (10%) were the most frequently reported mission focuses. Forty percent of small organizations reported a service population comprised of over 50% individuals/families at or below the poverty level.
Organizations with Medium Annual Budgets Between $100,000 and $999,999
Seventy-eight percent of survey respondents from organizations with medium budgets between $100,000 and $999,999 were directly associated with their organizations as employees (14%) or at an executive level (64%). Nonprofits comprised 93% of medium organizations. Medium organizations most frequently reported employing one to five people (64%) or six to ten people (14%). The median annual budget was $330,000. Medium organizations were often ten years of age or younger (28%), 11 to 25 years old (30%), or 26 to 50 years old (28%). Forty percent worked in a mix of service areas (rural, suburban, and urban), while 26% were in urban areas and 24% were in suburban areas. The most frequent geographic service reach for medium organizations was multi-county (28%), one county (16%), or multi-city/town (13%). Human Services (23%), Art, Culture, and Humanities (18%), and Education (9%) were the most frequently reported mission focuses. Forty-five percent of medium organizations reported a service population comprised of over 50% individuals/families at or below the poverty level.
Organizations with Large Annual Budgets Between $1 Million and $9,999,999
Eighty-six percent of survey respondents from organizations with large budgets between $1 million and $9,999,999 were directly associated with their organizations as employees (39%) or at an executive level (47%). Nonprofits comprised 92% of large organizations. Among respondents from educational institutions (3%), 67% represented K-12 schools. Large organizations most frequently reported employing six to ten people (15%), 11 to 25 people (35%), or 26 to 75 people (31%). The median annual budget was $2,500,000. Large organizations were usually 11 to 25 years old (22%), 26 to 50 years old (38%), or 51 to 100 years old (22%). Forty-five percent worked in a mix of service areas (rural, suburban, and urban), while 32% were in urban areas and 17% were in suburban areas. The most frequent geographic service reach for large organizations was multi-county (29%), one county (18%), or one state (12%). Human Services (29%), Education (11%), and Art, Culture, and Humanities (11%) were the most frequently reported mission focuses. Fifty-eight percent of large organizations reported a service population comprised of over 50% individuals/families at or below the poverty level.
Organizations with Very Large Annual Budgets Between $10 Million and $24,999,999
Eighty-eight percent of survey respondents from organizations with very large budgets between $10 million and $24,999,999 were directly associated with their organizations as employees (60%) or at an executive level (28%). Nonprofits comprised 80% of very large organizations. Among respondents from educational institutions (13%), 90% represented two- or four-year colleges and universities. Very large organizations most frequently reported employing 26 to 75 people (19%), 76 to 125 people (25%), 126 to 200 people (30%), or over 200 people (20%). The median annual budget was $15,000,000. Very large organizations were usually 26 to 50 years old (31%), 51 to 100 years old (35%), or over 100 years old (25%). Fifty-four percent worked in a mix of service areas (rural, suburban, and urban), while 30% were in urban areas. The most frequent geographic service reach for very large organizations was multi-county (37%), one state (14%), or multi-state (11%). Human Services (41%), Education (15%), and Health (7%) were the most frequently reported mission focuses. Fifty-eight percent of very large organizations reported a service population comprised of over 50% individuals/families at or below the poverty level.
Organizations with Extra-Large Annual Budgets $25 Million and Over
Eighty-one percent of survey respondents from organizations with extra-large budgets of $25 million and over were directly associated with their organizations as employees (57%) or at an executive level (24%). Nonprofits comprised 60% of extra-large organizations; 16% were tribal or government entities and 21% were educational institutions. Among respondents from educational institutions (25%), 24% represented K-12 schools and 76% represented two- or four-year colleges and universities. Extra-large organizations most frequently reported employing over 200 people (83%). The median annual budget was $55,282,000. Extra-large organizations were usually 26 to 50 years old (16%), 51 to 100 years old (42%), or over 100 years old (35%). Fifty-four percent worked in a mix of service areas (rural, suburban, and urban), while 31% were in urban areas and 12% were in suburban areas. The most frequent geographic service reach for extra-large organizations was multi-county (28%), multi-state (14%), international (13%), or one county (12%). Human Services (26%), Education (25%), and Health (19%) were the most frequently reported mission focuses. Forty-five percent of extra-large organizations reported a service population comprised of over 50% individuals/families at or below the poverty level.
Organization Mission Focus
The mission focus of the organization impacts organizational grantseeking activities. Just as with annual budget, variations in grant funding and sources underscore the value of comparing your organization to those with similar mission focuses.
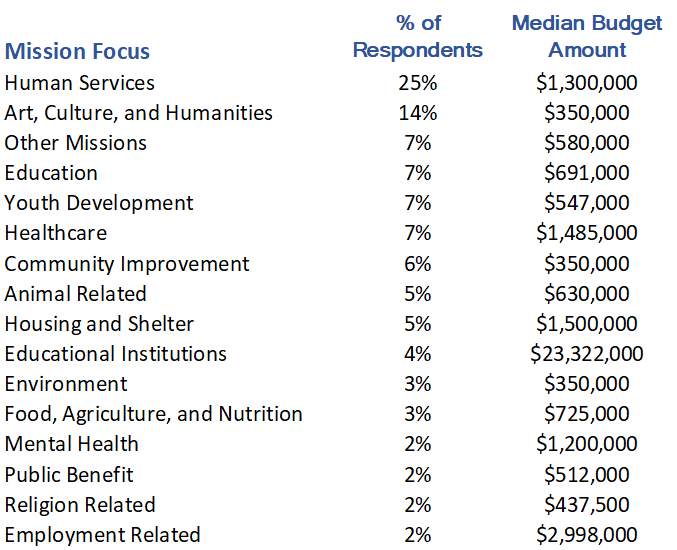
Of the 25 mission focus choices in The 2023 State of Grantseeking™ Survey, which are based on the National Taxonomy of Exempt Entities Classification System, 15 comprised 93% of respondent organizations. The remaining mission focuses (each of which had under 2% of respondents) were combined into the Other Missions category. For this report, mission focus classifications are defined below.
Total Funding
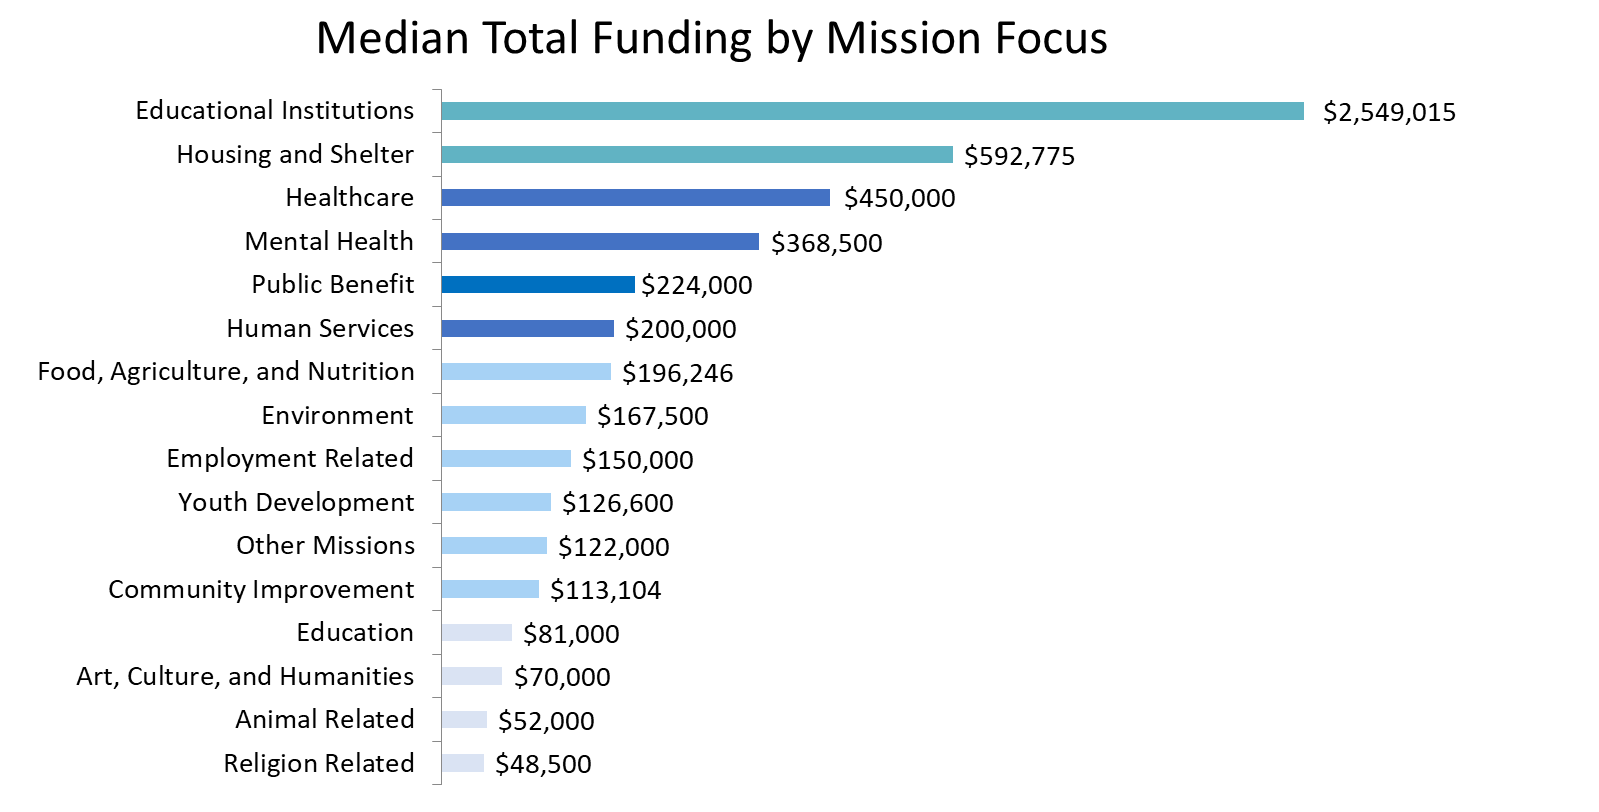
The median value of total awards varied substantially by organizational mission focus. Educational Institutions reported a median award total of $2,549,015, an outlier in total funding, and Housing and Shelter organizations had a median award total of $592,775. The remaining mission focuses had median total awards under $500,000. Religion Related organizations reported the lowest median award total of $48,500. The median value of total awards for all respondents was $150,000.
The following chart shows the median size of total grant awards reported by mission focus.
Largest Source Of Total Funding
Private foundations were most frequently reported as the largest source of total grant funding for organizations. Over 40% of Animal Related, Religion Related, and Food, Agriculture, and Nutrition organizations reported private foundations as the largest source of total grant funding. The Federal government was the most frequently reported largest source of total grant funding for Educational Institutions and Housing and Shelter organizations.
The missions with the highest rate of response for each source of funding are listed in the following chart.
Largest Individual Award
The median largest award size is greatly influenced by mission focus, ranging from $25,000 for Animal Related and Religion Related organizations to $1.5 million for Educational Institutions. Along with Educational Institutions, Housing and Shelter and Public Benefit organizations reported receiving the largest median individual awards. The median largest individual award for all respondents was $74,500. Again, remember the median largest award size is substantially higher for government sources and factor in these trends when setting realistic grantseeking expectations.
The following chart shows, by mission focus, the median award size for the largest individual grant award.
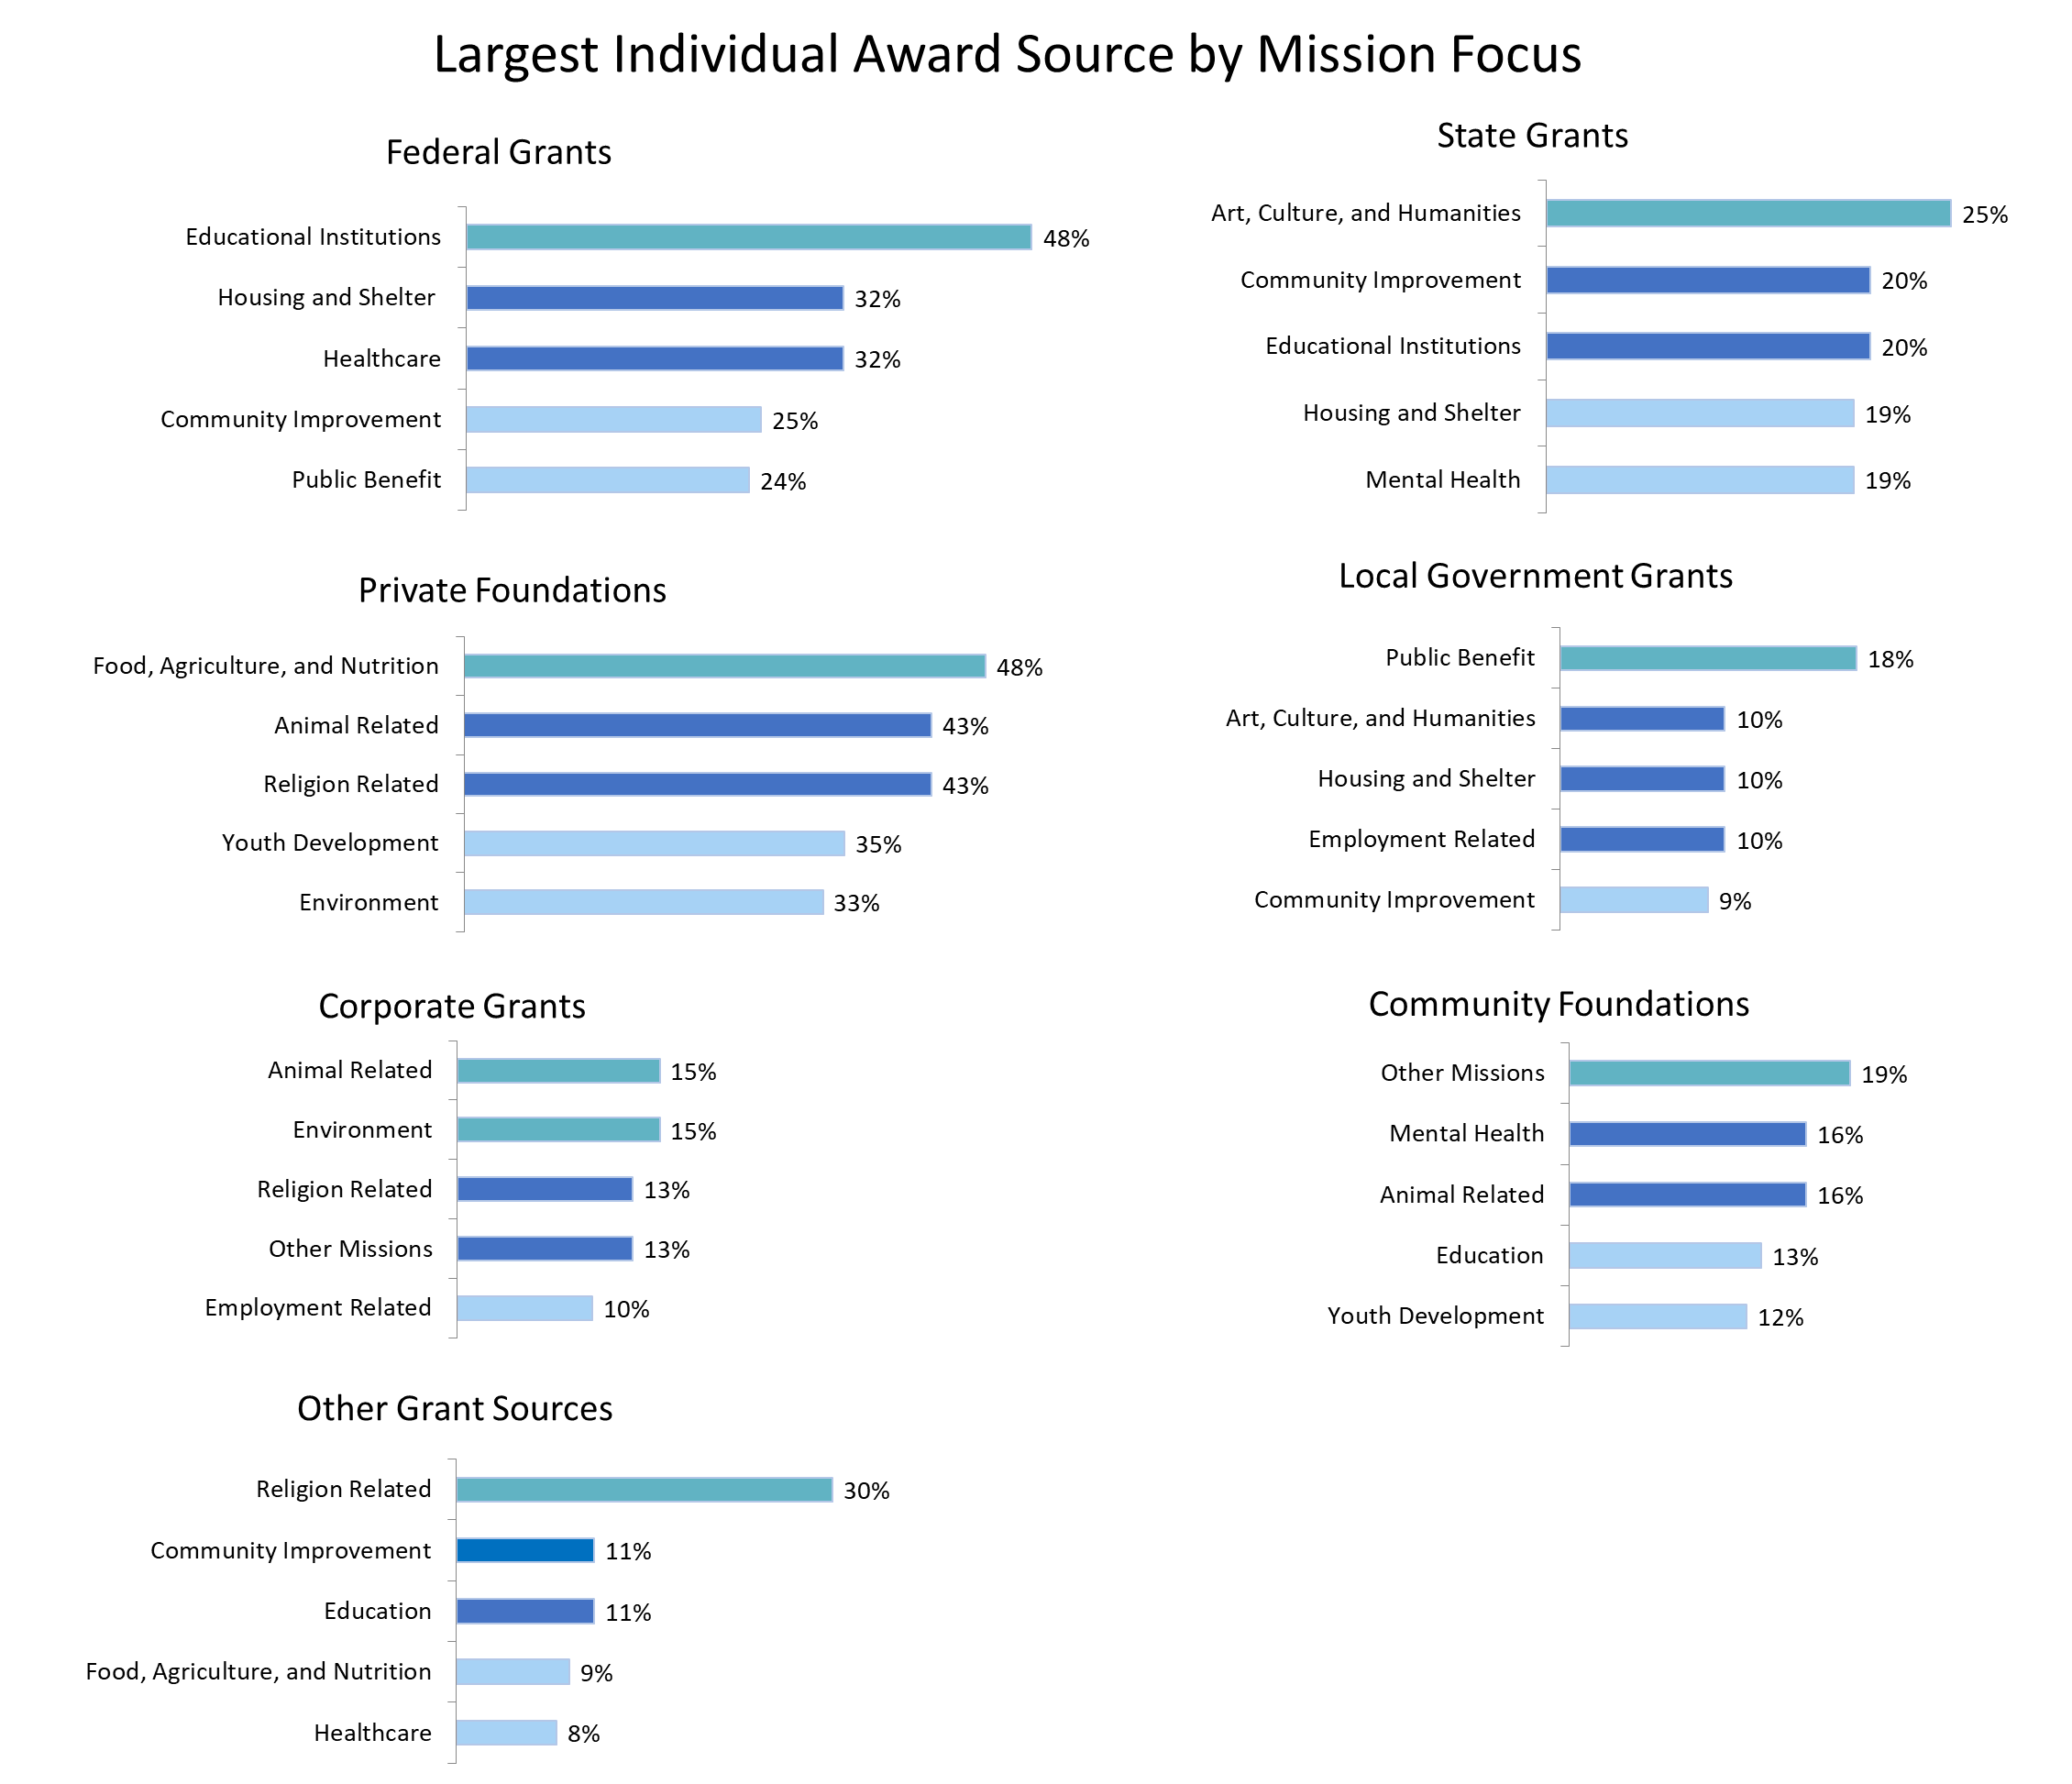
Largest Individual Award Source
As with the largest source of total grant funding, private foundations were the most frequent source of the largest individual award for organizations of most mission focuses. Educational Institutions, Healthcare, and Housing and Shelter missions are the exception, where the Federal government was the largest individual award source.
The missions with the highest rate of response for each source of funding are listed in the following chart.
Respondent Demographics
Organizational Affiliation
Of the respondents to The 2023 State of Grantseeking™ Survey, 89% were directly associated with the organizations they represented as executives (51%), employees (28%), board members (7%), or volunteers (3%). Consultants (8%) and government employees (3%) comprised the remaining 11% of respondents.
Type of Organization
Most respondents represented nonprofit organizations (88%). Other respondents included educational institutions (4%), businesses, consultants, and other agencies (3%), government entities and tribal organizations (3%), and libraries (1%). Among respondents from educational institutions, 29% represented K-12 schools, while 25% represented two-year colleges, and 46% represented four-year colleges and universities.
Organizational Age
Organizations ten years of age or under comprised 23% of respondents. Organizational ages of 11 to 25 years were reported by 23% of respondents, while 28% reported organizational ages of 26 to 50 years. Organizations of 51 to 100 years of age comprised 18% of respondents, and 8% of respondents were from organizations over 100 years of age.
Annual Budget
Respondent organizations reported the following annual budgets: less than $100,000 (17%), between $100,000 and $499,999 (27%), between $500,000 and $999,999 (12%), between $1 million and $4,999,999 (23%), between $5 million and $9,999,999 (7%), between $10 million and $24,999,999 (7%), and $25 million and over (8%).
The median annual budget of respondent organizations was $700,000.
Staff Size
All-volunteer organizations comprised 12% of respondents. Less than one full-time equivalent employee was reported by 6% of respondents. One to five people were employed by 31% of respondent organizations. Twenty-three percent of respondent organizations employed six to 25 people, while 11% employed 26 to 75 people. Eight percent of respondent organizations employed 76 to 200 people, and 9% employed over 200 people.
Primary Grantseeker
Most respondent organizations relied on staff members (70%) to fill the role of primary grantseeker. Board members (10%), volunteers (7%), and contract grant specialists (10%) were also cited as the primary grantseeker. Three percent of respondent organizations were not engaged with active grantseekers.
Grantseeking Staff Size
Most respondent organizations relied on one or two staff members (74%) as grantseeking resources. Three to five people were tasked as grantseekers by 18% of respondent organizations. Two percent of respondent organizations identified six to ten grantseeking staff members, and 2% employed over ten grant professionals. This question was not applicable for 5% of respondents.
Location
Within the United States, respondents came from all 50 states, the District of Columbia, and two territories. In addition, respondents from eight Canadian provinces participated, and 14 respondents were from countries outside of the United States and Canada.
Service Area
The 2023 State of Grantseeking™ Report utilizes the Census Bureau’s population-based area classification. Rural service areas containing fewer than 2,500 people were reported by 9% of respondents. Nineteen percent of respondents reported cluster/suburban service areas containing between 2,500 and 50,000 people. Urban service areas containing over 50,000 people were reported by 28% of respondents. In addition, 44% of respondents reported a service area comprised of a combination of these population-defined areas.
Geographic Reach
Organizations with an international, continental, or global geographic reach comprised 9% of respondents, while organizations with a national geographic reach comprised 8%. A multi-state organizational reach was reported by 10% of respondents, and 11% reported an individual-state reach. A multi-county reach was reported by 27% of respondents, while a one-county reach was reported by 15%. Eleven percent of respondents reported a multi-city or town organizational reach, while 7% reported a geographic reach within an individual city or town. In addition, 2% of respondents reported a reach comprised of other geographic or municipal divisions.
Poverty Level
Respondents were asked, “What percentage of your service recipients/clients/program participants are comprised of individuals/families at or below the poverty level?” Service to individuals or families in poverty was reported at a rate of 76% or more by 33% of respondents, while 16% reported serving those in poverty at a rate of 51% to 75%. Service to individuals or families in poverty at a rate of 26% to 50% was reported by 16% of respondents. Service to those in poverty at a rate of 11% to 25% was reported by 16% of respondents, while 8% reported a service rate of 10% or less to those in poverty. This question was not applicable for 11% of respondents.
Mission Focus
The 25 major codes (A to Y) from the NTEE Classification System, developed by the National Center for Charitable Statistics, were utilized as mission focus answer choices. Each mission focus choice had some respondents.
Half of the respondent organizations reported one of three mission focuses: Human Services (25%), Art, Culture, and Humanities (14%), and Education and Education Related (11%). The next most frequent mission focus responses were Youth Development (7%), Healthcare (7%), Community Improvement (6%), Animal Related (5%), Housing and Shelter (5%), Environment (3%), and Food, Agriculture, and Nutrition (3%). Missions focused on Mental Health, Public Benefit, Religion, and Employment were each reported by 2% of respondents. The remaining eleven mission focuses, reported at a rate of less than 2%, were aggregated into the category of Other (7%).
target Beneficiaries
We asked respondents to identify the intended beneficiaries of their organization’s mission and programs. The beneficiary definitions were provided by GrantAdvisor.org and encompassed gender, age, ethnicity, disability, health, citizenship status, military service, and income-related definitions.

Methodology
The 2023 State of Grantseeking™ Report presents a ground-level look at the grantseeking experience and focuses on funding from non-government grant sources and government grants and contracts. The information in this report, unless otherwise specified, reflects recent grantseeking activity during the year 2022. For the purpose of visual brevity, response rates are rounded to the nearest whole number; totals will range from 98% to 102%.
The 2023 State of Grantseeking™ Survey was open from February 10, 2023, through March 31, 2023, and received 2,463 responses. The survey was conducted online using Survey Monkey and was not scientifically conducted. Survey respondents are a nonrandom sample of organizations that self-selected to take the survey based on their affiliation with GrantStation and GrantStation partners. Due to the variation in respondent organizations over time, this report does not include trends. The 2023 State of Grantseeking ™ Report uses focused survey results, including data by mission focus or budget size, to provide a resource more closely matched to your specific organization.
This report was produced by GrantStation. The lead underwriters were Foundant Technologies and the Grant Professionals Association. Additional underwriters included ARNOVA, CampaignCounsel.org, and TechSoup. The survey was also promoted by many generous partner organizations via emails, e-newsletters, websites, and various social media outlets. Ellen C. Mowrer, Diana Holder, and Juliet Vile wrote, edited, and contributed to the report. For media inquiries or permission to use the information contained in The 2023 State of Grantseeking ™ Report in oral or written format, presentations, texts, online, or other contexts, please contact Ellen Mowrer at ellen.mowrer@grantstation.com.
Statistical Definitions
- Descriptive statistics: The branch of statistics devoted to the exploration, summary, and presentation of data. The State of Grantseeking Reports use descriptive statistics to report survey findings. Because this survey was not scientifically conducted, inference—the process of deducing properties of the underlying population—is not used.
- Mean: The sum of a set of numbers, divided by the number of entries in a set. The mean is sometimes called the average.
- Median: The middle value in a set of numbers.
- Frequency: How often a number is present in a set.
- Percentage: A rate per hundred. For a variable with n observations, of which the frequency of a certain characteristic is r, the percentage is 100*r/n.
- Population: A collection of units being studied.
About GrantStation

Serving both individuals and partners that represent hundreds of thousands of grantseekers, GrantStation is a premier suite of online resources for nonprofits, municipalities, tribal groups, and educational institutions. We write detailed and comprehensive profiles of grantmakers, both private and governmental, and organize them into searchable databases (U.S., Canadian, and International).

At GrantStation, we are dedicated to creating a civil society by assisting the nonprofit sector in its quest to build healthy and effective communities. We provide the tools for you to find new grant sources, build a strong grantseeking program, and write winning grant proposals.
- Do you struggle to identify new funding sources? We’ve done the research for you.
- Does the lack of time limit your ability to submit grant requests? We have tutorials on creating time and making space for grant proposals.
- Do you have a grants strategy? We offer a three-pronged approach to help you develop an overall strategy for adopting a powerful grantseeking program.
See what others are saying about GrantStation, and join today!
Keep abreast of the most current grant opportunities by signing up for our free weekly newsletter, the GrantStation Insider. (Sign up here.)
About the Underwriters
Welcome Home Grant Professional!
Are you searching for a place where you can connect with other grant professionals in the industry or find helpful ways to grow professionally? The Grant Professionals Association (GPA) is that place! The Grant Professionals Association, a nonprofit membership association, builds and supports an international community of grant professionals committed to serving the greater public good by practicing the highest ethical and professional standards.
You will find over 3,700 other grant professionals just like you. You can connect with your peers via GrantZone (GPA’s private online community) to share best practices, ask questions, and develop relationships.
You will have access to resources to help you succeed professionally with our annual conference (GrantSummit), over 100 webinars on our GrantSchool platform, an annual journal, weekly news articles, local chapters, product discounts, and more! When you join GPA you will receive a free subscription to GrantStation!
GPA is THE place for grant professionals. Now is the time for you to belong to an international membership organization that works to advance the profession, certify professionals, and fund professionalism. Receive your discount by using the discount code “GPA-25” when joining. Find out more at www.GrantProfessionals.org. Your association home awaits you.

Software solutions designed specifically for the unique needs of nonprofit organizations
With growing community needs, demands on nonprofit organizations have never been greater. How can your organization keep pace and continue to successfully pursue its mission with limited staff and resources? Put the right software in place to more effectively manage your nonprofit’s operations so that you’ll have more time to focus your energy on maximizing your impact on the communities you serve.
GrantHub
Intuitive online grant management software for nonprofits and grant consultants designed to help you find the grant funding you need, develop strong relationships with your funders, streamline the grant application process, and ensure you deliver on grant commitments.
GrantHub helps you win more grants:
- Manage relationships, tasks, and grant deadlines
- Find potential funders and grant opportunities
- Track and report your fundraising progress
- Catalog important funder and grant documents
- Maintain relationships and history despite staff turnover
- Streamline proposal creation using common application responses
NonprofitCore
Designed specifically for nonprofits, NonprofitCore manages your organization’s core activities in one intuitive, easy-to-use solution:
- Fundraising and Grant Management
- Constituent Relationship Management
- Accounting
- Reporting and Analytics
NonprofitCore helps save time, money, and resources; increase data integrity and security; and enable greater team collaboration and effectiveness. With all your data in one system, you’ll have more time to focus your energy on creating lasting sustainability and long-term program success.
ABOUT US
The Association for Research on Nonprofit Organizations and Voluntary Action (ARNOVA) is a diverse community of scholars, educators, and practice leaders that strengthens the field of nonprofit and philanthropic research in order to improve civil society and human life.
ARNOVA is committed to growing the organization by bringing in new members across different sectors. We believe connecting diverse voices - students, professors, funders, and practitioners - can lead to societal improvement.

ARNOVA is a community; we are where higher learning and the nonprofit sector meet.
Benefits of being an ARNOVA member
ARNOVA provides opportunities to connect with peers across the globe working in academic, think tank, philanthropic, and nonprofit organizations. Many members join ARNOVA to be a part of our annual conferences and our Sections & Groups - both of which lead to members networking and exchanging ideas.
Members also get a subscription to Nonprofit and Voluntary Sector Quarterly, ARNOVA’s field-leading journal, and ARNOVA News, our email newsletter. It contains news of the Association and its members and articles about members' research.
Learn more about our membership benefits at www.arnova.org/member-benefits/
Have questions? Contact us at info@arnova.org
Are you considering a Capital Campaign? This free Guide to Capital Campaigns will help as you prepare.
CampaignCounsel.org offers full-scope capital campaign services designed to address your unique organization and community. We provide capital campaign leadership, planning, and management for nonprofits embarking on multimillion-dollar building projects across the globe. Our services include needs assessments and capital campaign planning and management.
A trusted partner for three decades, TechSoup (meet.techsoup.org) is a nonprofit social enterprise that connects organizations and people with the resources, knowledge, and technology they need to change the world.
Need tech on a nonprofit budget?
With 60+ partner nonprofits, we manage a unique philanthropy program that brings together over 200 tech companies to provide technology donations to NGOs globally. We have reached 1.2M+ nonprofits and distributed technology products and grants valued at $15 billion. U.S. nonprofits can find out more at www.techsoup.org.
Interested in in-depth training tailored to nonprofits and public libraries?
TechSoup offers a range of options from free webinars to TechSoup Courses tackling nonprofits’ most pressing tech questions. Sign up for expert-led tech training at https://www.techsoup.org/courses.
Want to chat in person?
Our free TechSoup Connect events connect nonprofits, tech experts, and community leaders. They offer a supportive community, hands-on learning, and networking for everybody who wants to use technology for social good. Find a free event near you at: https://events.techsoup.org/.